
A/B Test Headlines: Boost CTR 15% with Proven Methods
You pour hours into crafting the perfect headline, launch your campaign, and watch traffic trickle in with disappointing conversion rates. The problem isn't your creativity. It's that you're guessing instead of testing. A/B testing headlines systematically reveals which variations actually convert, increasing engagement rates by 10-20% when done correctly. This guide walks you through efficient, data-driven methods to transform your headline testing from guesswork into a reliable growth engine.
Table of Contents
- Prerequisites: Tools And Knowledge You Need Before Starting
- Step 1: Designing Your Headline Variations
- Step 2: Setting Up And Running Your A/B Test
- Step 3: Analyzing Results And Deciding The Winner
- Common Mistakes And Troubleshooting In Headline Testing
- Expected Results And Outcomes: What To Aim For
- Alternative Approaches And Tradeoffs
- Explore Advanced A/B Testing Tools & Resources
- Frequently Asked Questions
Key Takeaways
| Point | Details |
|---|---|
| Conversion Impact | Proper headline A/B testing increases conversion rates by 10-20% when run with sufficient traffic and duration. |
| Test Duration | Run tests for 7-14 days minimum to achieve statistical significance and avoid premature conclusions. |
| Tool Selection | Lightweight, no-code A/B testing platforms accelerate iteration cycles by 30% while eliminating developer dependencies. |
| Headline Variants | Design 3-5 headline variations incorporating emotional triggers and personalization to maximize test impact. |
| Advanced Methods | Multivariate testing provides deeper insights but requires 3x more traffic and extended timelines compared to standard A/B tests. |
Prerequisites: Tools and Knowledge You Need Before Starting
Before launching your first headline test, you need the right foundation. The tools you choose and the concepts you understand determine whether your tests produce reliable insights or misleading data.
Start with lightweight A/B testing tools that won't drag down your site performance. Lightweight A/B testing tools minimize website impact and improve test data reliability, keeping your page load times under 3 seconds while collecting accurate engagement metrics. Look for platforms with no-code visual editors that let you launch tests without waiting for developer availability.
Your tool stack should include:
- Real-time analytics dashboards that update within minutes, not hours
- Traffic segmentation capabilities by device type, referral source, and user behavior
- Statistical significance calculators built into the platform
- Pricing tiers that fit small to medium business budgets, ideally with free starter plans
Beyond tools, grasp basic conversion metrics. Understand what click-through rate (CTR) measures versus conversion rate. Learn why statistical significance matters and how sample size affects test validity. Develop a clear segmentation strategy before you start testing headlines effectively, because mobile users often behave differently than desktop visitors.
Pro Tip: Prioritize platforms offering real-time analytics dashboards. Waiting 24 hours for data updates wastes precious optimization time and delays your ability to spot trends early.
Once your tools are ready and you understand the metrics, you can confidently design headline variations that produce meaningful test results. The next step focuses entirely on creating those high-impact variants.
Step 1: Designing Your Headline Variations
Your headline variations make or break the entire test. Generic, barely different options won't reveal what actually drives clicks. You need deliberate diversity in your approaches.
Create 3-5 headline variants for each test. This range provides enough options to identify patterns without diluting your traffic across too many versions. Each variant should explore a distinct angle: one emphasizing urgency, another highlighting specific benefits, a third using curiosity-driven language.
Including emotional triggers dramatically improves performance. Fear of missing out, aspirational language, or problem-solution framing can increase conversion rates by 7-15% compared to purely informational headlines. Test emotional versus rational appeals to discover what resonates with your specific audience.
Personalization amplifies these effects. Dynamic keyword insertion boosts CTR by about 15% by matching headlines to user search terms or referral sources. If someone searches "budget CRM software," show them a headline featuring "budget" rather than generic "affordable" language.
Balance clarity with intrigue. One headline variation might state the benefit directly: "Reduce Customer Churn by 25% in 60 Days." Another teases the solution: "The Overlooked Metric That Cut Our Churn in Half." Both communicate value, but through different psychological pathways.
Follow this design sequence:
- List your core value propositions and benefits
- Translate each into 2-3 emotional angles (urgency, curiosity, aspiration)
- Create personalized variants using dynamic insertion where possible
- Write one clear, benefit-focused control headline
- Draft 2-4 alternative approaches testing different triggers
Pro Tip: Use data from your initial tests to refine headline themes continuously. If urgency-driven headlines consistently outperform curiosity-based ones, double down on urgency angles in your next iteration while testing secondary variables like specific numbers or time frames.
With compelling variations ready, the technical setup determines whether you collect valid, actionable data.
Step 2: Setting Up and Running Your A/B Test
Poor test configuration undermines even the best headline variations. Your setup process determines data quality and how quickly you reach reliable conclusions.

Run each test for 7-14 days minimum, or until you achieve statistical significance (typically 95% confidence level). Shorter tests risk capturing anomalies rather than true patterns. Longer tests smooth out day-to-day fluctuations and account for weekly traffic cycles, especially important if your audience includes B2B buyers who behave differently on weekends.
Segment your traffic properly. Device type alone can skew results by 25% if not controlled. Mobile users scan quickly and prefer shorter, punchier headlines. Desktop visitors tolerate more detail. Segment by:
- Device category (mobile, tablet, desktop)
- Traffic source (organic search, paid ads, social media, email)
- New versus returning visitors
- Geographic location if your product has regional variations
Real-time analytics dashboards updating every minute reduce iteration cycles by 30%, allowing you to spot early trends and adjust problematic configurations before they waste your entire test window. Monitor these core metrics throughout:
- Click-through rate (CTR) on the headline itself
- Conversion rate from click to desired action
- Engagement time on the landing page
- Bounce rate changes compared to baseline
Use this segmentation matrix to visualize your setup:
| Traffic Segment | Sample Size Needed | Expected Test Duration | Primary Metric |
|---|---|---|---|
| Mobile Organic | 2,000+ visits | 10-14 days | CTR, Bounce Rate |
| Desktop Paid | 1,500+ visits | 7-10 days | Conversion Rate |
| Returning Users | 1,000+ visits | 14+ days | Engagement Time |
| New Visitors | 2,500+ visits | 10-14 days | CTR, Conversion Rate |
Your real-time analytics guide should show these metrics updating continuously. If one variation dramatically underperforms within the first 48 hours across all segments, you have early signal, but don't conclude yet.
Pro Tip: Avoid terminating tests prematurely even when early results look decisive. Traffic patterns shift, and what appears to be a 20% lift on day three might regress to 5% by day ten. Let the test reach statistical significance before declaring a winner.
Once your test window closes and significance is reached, the analysis phase determines whether you correctly interpret A/B test analytics or fall prey to common interpretation errors.
Step 3: Analyzing Results and Deciding the Winner
Data collection is straightforward. Data interpretation is where most marketers stumble and choose losing headlines.
Prioritize statistically significant lifts in your primary metrics. Look for CTR and conversion lifts of at least 5-10% to confidently select winners. Smaller improvements might represent noise rather than genuine performance differences. A 2% CTR increase could disappear entirely once you account for confidence intervals.
Examine secondary metrics before finalizing your decision. A headline that increases CTR by 15% looks impressive until you notice it also raised bounce rate by 20%. That headline attracted clicks but failed to set accurate expectations, bringing in the wrong traffic. Evaluate:
- Time on page (are visitors engaging with content?)
- Scroll depth (do they read beyond the headline?)
- Conversion funnel completion rates
- Revenue per visitor if you have e-commerce tracking
Control for external factors rigorously. A holiday promotion running simultaneously with your test will inflate conversion rates artificially. Seasonal shopping patterns, competitor campaigns, and even weather events can skew results.
"About 20% of tests falsely appear successful due to unadjusted external factors."
If no clear winner emerges after a full test cycle, don't force a decision. Ambiguous results mean your variations were too similar or your traffic volume was insufficient. Plan a second iteration with more dramatically different approaches or extend the test duration.
When interpreting headline test results, document everything: which variation won, by what margin, across which segments, and under what external conditions. This documentation builds institutional knowledge and prevents you from retesting identical hypotheses months later.
Even with careful analysis, common mistakes can invalidate your conclusions. The next section helps you identify and avoid these pitfalls.
Common Mistakes and Troubleshooting in Headline Testing
Most headline tests fail not from bad variations but from execution errors that corrupt the data.
Insufficient test duration tops the list. About 30% of tests get stopped too early, either because marketers grow impatient or because early results look convincing. A headline leading by 18% on day two might finish tied by day ten. Respect the minimum 7-14 day window and statistical significance thresholds.
Poor traffic segmentation creates the second most common problem. If you don't segment by device and traffic source, you might conclude Headline A wins overall, missing that it only wins with mobile organic traffic while losing everywhere else. This false positive leads to split testing headlines that decrease performance for significant audience segments.
Other frequent errors include:
- Testing during atypical periods (major holidays, industry conferences, end of quarter)
- Running overlapping tests that contaminate each other's data
- Changing test parameters mid-flight (adding new variations, adjusting traffic split)
- Ignoring common testing errors like sample ratio mismatch
- Testing too many variations without sufficient traffic to reach significance
Seasonality and campaign overlap require special attention. If you launch a test the same week as a major email campaign, your results will reflect the combined effect of new headlines plus increased brand awareness from the emails. Isolate variables by pausing other major initiatives during critical test windows.
Sample size matters more than most marketers realize. Testing five headline variations when you only get 500 visitors per week means each variation sees 100 visitors. That's nowhere near enough for statistical validity. You need 1,000+ visitors per variation minimum, more if your baseline conversion rate is low.
Pro Tip: Keep testing cycles consistent and document every setup detail in a testing log. Note traffic volumes, external campaigns, seasonal factors, and technical configurations. Review this log before launching new tests to avoid repeating past mistakes or testing during historically problematic periods.
With errors avoided and proper methodology in place, you can set realistic expectations for what your testing efforts should achieve.
Expected Results and Outcomes: What to Aim For
Understanding typical performance benchmarks helps you gauge whether your tests are succeeding and where to focus improvement efforts.
Well-executed headline A/B tests typically yield conversion rate improvements between 10-20%. This range assumes you started with a decent baseline and tested meaningfully different approaches. If your current headlines are genuinely poor, you might see 30-40% lifts. If they're already optimized, expect smaller 5-10% gains from incremental refinements.
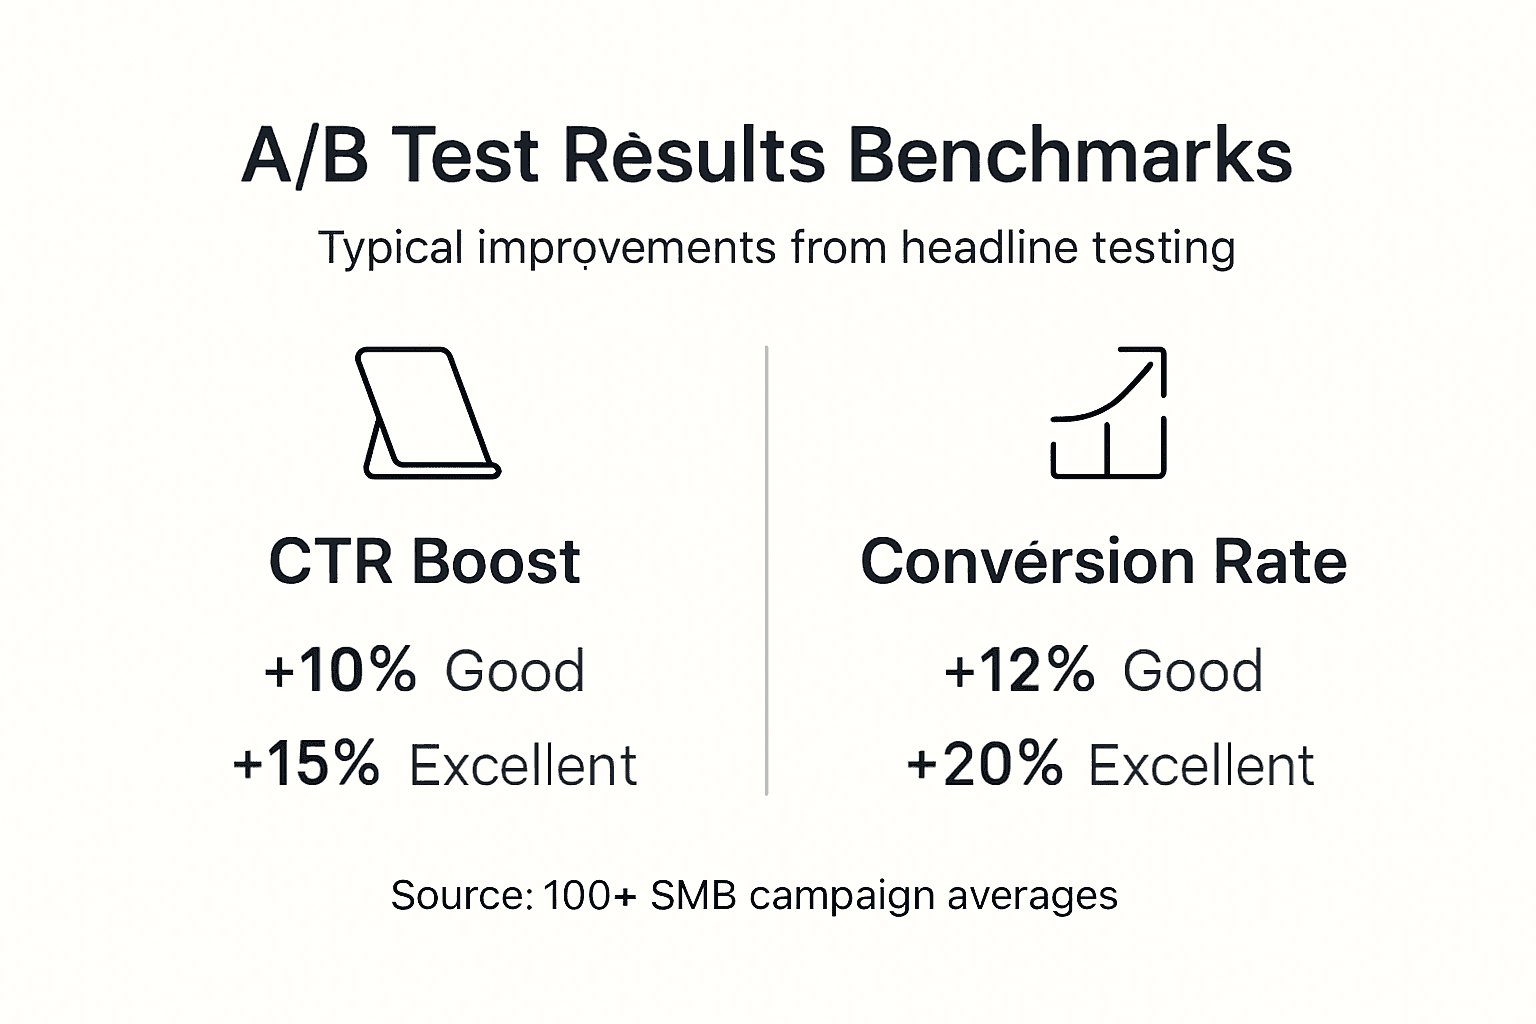
Personalization through dynamic keyword insertion reliably increases CTR by 15% or more, particularly for paid traffic where you can match headlines precisely to ad copy and search terms. The effect diminishes slightly with organic traffic because search intent varies more widely.
No-code testing platforms accelerate your iteration speed dramatically. Traditional testing requiring developer implementation for each variant can take 2-3 weeks per cycle. Modern tools collapse this to 2-3 days, a 40% improvement in iteration velocity that compounds over time.
Use these benchmarks to set goals:
| Metric | Baseline | Good Improvement | Excellent Improvement |
|---|---|---|---|
| Conversion Rate | 2-3% | +10-15% (2.2-3.45%) | +20%+ (2.4-3.6%+) |
| Click-Through Rate | 3-5% | +12-18% (3.36-5.9%) | +20%+ (3.6-6%+) |
| Iteration Speed | 14 days/cycle | 7-10 days/cycle | 3-5 days/cycle |
| Revenue per Visitor | $2.50 | +8-12% ($2.70-2.80) | +15%+ ($2.88+) |
These headline test outcome benchmarks reflect performance across hundreds of SMB campaigns. Your specific results depend on your industry, audience maturity, and baseline headline quality.
Set achievable incremental goals rather than expecting dramatic transformation from a single test. A 12% conversion improvement might sound modest, but across 10,000 monthly visitors, that's 120 additional conversions. Compound that over a year of continuous testing, and you're looking at 30-40% cumulative improvement.
While A/B testing delivers reliable results efficiently, alternative approaches offer different tradeoffs worth understanding.
Alternative Approaches and Tradeoffs
A/B testing isn't your only option for headline optimization, though it's usually the best choice for SMBs with limited traffic.
Multivariate testing examines combinations of headline elements simultaneously. Instead of testing three complete headlines, you test three different value propositions combined with two different emotional tones and two different formats. This reveals which specific elements drive performance, not just which complete package wins.
The catch? Multivariate tests require roughly 3x more traffic than equivalent A/B tests because they're splitting visitors across many more combinations. Testing three headline elements with two options each creates eight total combinations. You need adequate sample size for all eight, pushing required traffic from 3,000 visitors to 9,000+ visitors.
Timeline differences are equally significant:
| Approach | Typical Duration | Traffic Required | Complexity | Insights Depth |
|---|---|---|---|---|
| A/B Testing | 7-14 days | 3,000-5,000 visits | Low | Winner identification |
| Multivariate Testing | 21-42 days | 10,000-20,000 visits | High | Element-level analysis |
| Sequential Testing | 14-28 days | 5,000-8,000 visits | Medium | Iterative refinement |
When to choose each method:
- Use A/B testing when traffic is under 50,000 monthly visitors
- Use A/B testing for quick wins and fast iteration cycles
- Choose multivariate testing only when you have 100,000+ monthly visitors
- Pick multivariate when you need to understand which specific elements matter most
- Consider sequential testing (a series of focused A/B tests) as a middle ground approach
For most SMB marketers, split testing headlines through straightforward A/B methodology delivers better ROI than complex multivariate approaches. You'll reach actionable conclusions faster and can reinvest saved time into testing additional page elements.
Multivariate testing makes sense once you've exhausted obvious A/B test opportunities and have sufficient traffic to support longer, more complex experiments. Until then, stick with focused A/B tests that produce reliable results within your resource constraints.
Now that you understand the complete methodology, discover tools that simplify implementation and accelerate your testing program.
Explore Advanced A/B Testing Tools & Resources
You've learned the strategy. Now implement it with tools built specifically for marketers who need speed without technical complexity.
GoStellar provides no-code A/B testing designed for SMB marketing teams. The platform's lightweight 5.4KB script ensures your tests don't slow page performance while its visual editor lets you create and launch headline tests in minutes, not days. Real-time analytics update continuously so you spot winning variations faster.

The platform combines essential features marketers need: dynamic keyword insertion for personalized headlines, advanced goal tracking across your conversion funnel, and traffic segmentation by device and source. Free plans support businesses with under 25,000 monthly users, scaling affordably as your traffic grows.
Learn A/B testing best practices through comprehensive guides covering everything from statistical significance to test design. The landing page A/B testing guide walks through complete optimization workflows. For teams without developer resources, the no developer A/B testing handbook removes technical barriers entirely.
"Empower your marketing team to iterate faster and convert better with GoStellar tools."
These resources transform headline testing from a complex technical project into a routine marketing activity you execute weekly, building continuous improvement into your growth engine.
Frequently Asked Questions
What is the ideal number of headline variations to test at once?
Test 3-5 headline variations per experiment to balance statistical validity with practical traffic requirements. Two variations work for high-traffic sites but provide limited insight into what drives performance. Six or more variations require enormous traffic volumes and extend test duration beyond practical limits for most SMBs.
How long should I run headline A/B tests to ensure valid results?
Run tests for a minimum of 7-14 days or until you reach statistical significance at 95% confidence, whichever comes later. This duration accounts for weekly traffic patterns and smooths out daily anomalies. Stopping earlier risks false positives, while running substantially longer rarely changes conclusions if you've reached significance.
Can I run headline tests without a developer?
Yes, modern no-code A/B testing platforms include visual editors that let marketers create and launch tests independently. You simply point, click, and edit headline text directly on your live page without touching code. The platform generates test variants automatically and handles all technical implementation including traffic splitting and data collection.
What metrics besides CTR should I consider for headline success?
Evaluate conversion rate as your primary success metric since it directly measures business impact. Also examine engagement time, bounce rate, and scroll depth to ensure your headline attracts qualified visitors who engage with content rather than just curious clickers who immediately leave. Revenue per visitor provides the ultimate validation for e-commerce sites.
How do I avoid false positives in headline testing?
Control for external factors by documenting seasonal patterns, concurrent campaigns, and unusual events during your test window. Wait for statistical significance rather than declaring winners based on early trends. Segment your traffic to ensure performance is consistent across device types and traffic sources rather than driven by a single anomalous segment. Validate major findings with a follow-up confirmation test before making permanent changes.
Recommended
Published: 3/4/2026