
Beat a 4.6% Baseline: Fast Tests for Digital Marketing Conversion Rate
Conversion rate is the share of visitors who complete a target action, calculated as conversions divided by sessions, users, or clicks and multiplied by 100. A healthy figure ranges from roughly 1.5% for SaaS free trials to nearly 7% for home services searches, so the right question is never "is 3% good?" but "is 3% good for my channel mix and page type?" Start by pulling your own last 90 days of data by channel before you touch a single benchmark table.
TL;DR:
- Use the correct denominator for your conversion rate, such as sessions, users, or ad clicks, and lock it in before analyzing data.
- Benchmark averages vary significantly by industry and page type, so compare your performance to relevant segments rather than broad averages.
- Improving traffic quality and device experience, especially load speed on mobile, can yield the most immediate gains in conversion rate.
- Segment your data by channel, device, and visitor type to uncover hidden issues and avoid misleading overall numbers.
- Focus on high-impact tests like simplifying forms, clarifying CTAs, and enhancing page speed, and ensure your tracking setup is accurate and consistent.
Table of Contents
- What Digital Marketing Conversion Rate Actually Measures
- Conversion Rate Benchmarks by Channel and Industry
- What Actually Moves Your Conversion Rate
- Setting Up Tracking You Can Actually Trust
- Building a CRO Playbook That Prioritizes the Right Tests
- Running a Fast Test: A Practical Workflow Example
- Common Conversion Rate Pitfalls and How to Avoid Them
- How to Segment Conversion Rates for Deeper Insight
- The Role of UX Design in Conversion Rate
- Customer Journey Stages and Their Effect on Conversion Rate
- Personalization and Dynamic Content as Conversion Levers
- Why Benchmarks Alone Won't Fix Your Conversion Rate
- Turn Benchmarks Into Real Lift
- Sources
What Digital Marketing Conversion Rate Actually Measures
The formula looks simple: conversions ÷ denominator × 100. The trouble is picking the right denominator, and most marketers get this wrong without realizing it.
Google Analytics defines ecommerce conversion rate as transactions divided by sessions, not by users, which matters because one visitor can generate multiple sessions in a reporting window. A session-based rate will always run a bit lower than a user-based one, since repeat sessions from the same person inflate the denominator without adding new converters. Click-based rates, common in paid search reporting, measure a narrower slice again: conversions per ad click rather than per landing session.
Separate your macro conversions (a purchase, a signed contract, a booked demo) from micro-conversions (an email signup, a video watched, a spec sheet downloaded). Both matter, but blending them into one number hides where the funnel actually leaks.
- Session-based CR: conversions ÷ sessions. Best for comparing traffic sources.
- User-based CR: conversions ÷ unique users. Better for understanding true customer conversion.
- Click-based CR: conversions ÷ ad clicks. Standard in PPC platforms.
- Macro vs. micro: track both, but report them separately, never combined.
Whatever you choose, lock the denominator and the attribution window before you start comparing periods. Switching definitions mid-quarter is the single fastest way to make a flat quarter look like a crisis.
Conversion Rate Benchmarks by Channel and Industry
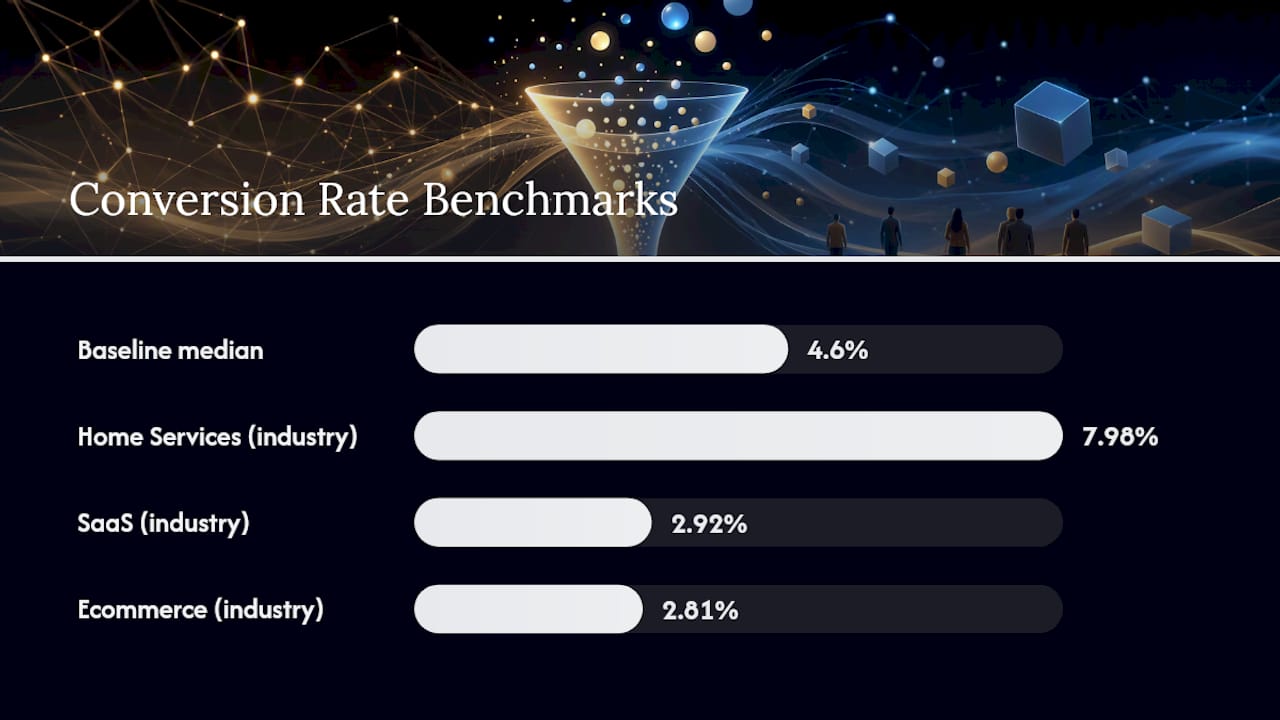
Numbers without context are noise, so here's the context. Across a sample of 1,055 audited A/B tests, the median baseline conversion rate landed at 4.6%, but the spread by business model is wide: SaaS trials converted around 1.5%, while B2C retail sites hit 6.8%.
Channel-level medians tell a similar story of wide variance:
- Google Ads search: median around 7.04%, often the strongest paid channel because intent is explicit.
- Email: roughly 11.8%, the highest-converting channel in most archives because the audience already opted in.
- Organic search: around 3.0%, dragged down by informational queries mixed with buying intent.
- Landing pages: median near 2.35% sitewide, though targeted landing pages built for a single offer regularly beat that when the creative matches the ad.
- Display and social: typically the lowest-intent traffic, often sitting below organic.
Statistic Callout: Industry medians diverge just as sharply as channel medians. Home Services sites convert at roughly 7.98%, SaaS sits near 2.92%, and Ecommerce lands around 2.81%. Benchmarking a SaaS company against a home services median would mean chasing a target that was never realistic in the first place.
Page type shifts these numbers again. A checkout page with cart abandoners in the mix will underperform a dedicated landing page built for one traffic source with one offer. Sitewide averages blend browsing sessions with buying sessions, which is why Search Engine Land argues that a blended figure like 4.8% is far less useful than segmenting by page type and channel before you draw any conclusion.
What Actually Moves Your Conversion Rate
Four forces explain most of the variance you'll see between a good month and a bad one, and they're worth ranking in order of impact.
Traffic quality comes first. A visitor who clicked an email you sent to an engaged list is a different animal from someone who landed via a display ad they barely noticed. Returning visitors convert at roughly 1.8 times the rate of new visitors, which means a shift in your traffic mix toward more repeat visits will lift your blended rate even if nothing on the page changes.
Device experience runs a close second. Mobile traffic often carries different intent and different friction points than desktop, from smaller tap targets to slower load times on cellular connections.
- Site speed: about 53% of mobile visits get abandoned when a page takes more than three seconds to load fully.
- Tracking fidelity: a form that fires two conversion events instead of one will quietly inflate your rate until someone audits it.
- CTA clarity: one button, one clear next step, beats three competing calls to action every time.
- Form friction: every extra field is a reason for someone to abandon.
- Trust signals: reviews, security badges, and clear pricing reduce hesitation at the exact moment someone decides to act.
Pro Tip: Before you touch design or copy, check your page load time on a throttled mobile connection. A slow page makes every other optimization irrelevant because half your visitors never see the CTA you just redesigned.
Setting Up Tracking You Can Actually Trust
A conversion rate is only as good as the tracking behind it, and most CRO programs fail here before they even start testing.
- Define your goals as events in GA4 and confirm each event fires exactly once per genuine conversion, not once per page load or button hover.
- Document your denominator and attribution window in writing. Decide sessions or users, first click or last click, a 7 day or 30 day window, and keep it fixed across every report you run.
- Audit for duplicate tags. Duplicate Google Tag Manager containers or a stray Google Ads tag firing alongside GA4 will double count conversions without any obvious warning sign.
- Check cross-domain tracking if your checkout or booking flow lives on a different subdomain or third-party platform, since a broken cross-domain setup silently drops sessions from the funnel.
- Build a tool stack that covers the full chain: GA4 for reporting, Google Tag Manager for deployment, server-side tagging if you need to work around ad blockers, and an experiment platform that logs its own goal completions independently of GA4 so you can cross-check the numbers.
Our conversion tracking guide walks through the GA4 setup in more detail if you're starting from scratch.
Building a CRO Playbook That Prioritizes the Right Tests
Not every idea deserves a test slot. A simple prioritization framework, impact times confidence times ease, keeps you from spending three weeks on a button color change while a broken checkout flow sits untouched.
Score each idea from 1 to 5 on how much it could move the needle, how confident you are based on data or research, and how easy it is to build. Multiply the three scores together. A form-simplification test that scores 4 on impact, 4 on confidence, and 5 on ease (80 points) should run before a full page redesign that scores 5, 2, and 1 (10 points), even though the redesign sounds more exciting.
The tests worth running first, in most funnels, can benefit greatly from conversion rate optimization tips that provide tactical guidance on improving results.
- Headline and offer clarity: does the visitor immediately understand what they get and why it matters?
- Primary CTA: one button, unambiguous language, placed where the eye naturally lands.
- Form simplification: cut every field that isn't strictly necessary to complete the action.
- Price and packaging clarity: confusing tiers or hidden fees kill conversions at the exact moment of decision.
- Page speed: often the highest-leverage fix on the list, since it affects every visitor regardless of what else you test.
Statistic Callout: Returning visitors convert around 7.4% versus 4.2% for new visitors in one large archive of audited tests, an almost 1.8x gap. If your traffic mix is heavy on new visitors, your easiest wins often come from retargeting and email nurture rather than page tweaks.
Test design matters as much as test selection. Calculate the sample size you need before launching, based on your current baseline rate and the minimum lift you'd consider meaningful. Resist checking results daily and calling a winner early. Peeking at a test before it reaches its planned sample size inflates false positive rates, because random noise looks like a trend when the sample is small. Let the test run through at least one full business cycle, typically one to two weeks minimum, to smooth out day-of-week effects. Our step-by-step CRO checklist covers the build-to-launch process in more detail, and our A/B testing ideas post has specific variations to try on landing pages.
Running a Fast Test: A Practical Workflow Example
Speed matters twice in CRO: page speed for the visitor, and setup speed for the marketer who wants to launch a test this week instead of next quarter.
A lightweight testing script that loads asynchronously avoids the flicker and lag that heavier tools introduce, which protects the very conversion rate you're trying to improve. Pair that with a no-code visual editor and a marketer can build a variation without waiting on a developer.
- Define the hypothesis: "Simplifying the signup form from 6 fields to 3 will increase completions."
- Build the variation directly in a visual editor, no code required.
- Set the goal to the specific form-submission event, not a proxy metric.
- Run it until you hit your predetermined sample size.
- Analyze and roll out the winner, or document the loss and move to the next hypothesis.
Pro Tip: A script under 10KB loads before most trackers finish their first request. That difference sounds small, but on mobile it's the gap between a test that skews your results and one that doesn't. Gostellar's script runs at 5.4KB for exactly this reason, so testing doesn't become the thing that slows down the page you're trying to fix.
Common Conversion Rate Pitfalls and How to Avoid Them
The most common mistake is comparing your rate to a generic industry average without checking whether that average matches your traffic mix, your page type, or your business model. A SaaS company benchmarking against ecommerce medians will always look worse than it is.
The second mistake is inconsistent measurement windows. Comparing a 7 day rate against a 30 day rate, or switching from session-based to user-based reporting halfway through a quarter, makes trend lines meaningless even when nothing on the site actually changed.
Tracking errors compound both problems. Duplicate conversion tags, broken cross-domain tracking, and goals that fire on page load instead of on actual completion all inflate or deflate your reported rate without your knowledge. Audit your tags quarterly, not just when something looks obviously wrong.
Chasing statistical significance too early causes a fourth, quieter problem. A test that shows a 20% lift after two days and 200 conversions is usually noise, not signal. Waiting for your predetermined sample size feels slow, but it's the only way to trust the result enough to act on it.
Finally, optimizing a single page in isolation while ignoring the traffic feeding it wastes effort. A beautifully redesigned landing page still underperforms if the ad copy driving traffic to it sets the wrong expectation. Match the message on the ad to the message on the page, every time, before you touch anything else.
How to Segment Conversion Rates for Deeper Insight
A single blended conversion rate hides more than it reveals. Segmenting by device is the first cut worth making, since mobile and desktop visitors often behave completely differently depending on your product and checkout flow. A site with a clunky mobile checkout might show a healthy blended rate that's actually propped up entirely by desktop performance.
Channel segmentation comes next. Because email, organic, paid search, and social carry such different intent levels, a channel-level breakdown tells you where to spend your optimization time. If paid social drives volume but converts at a third of your email rate, that gap deserves investigation before you spend more budget scaling social.
Demographic and geographic segments matter too, particularly for businesses with a wide customer base. Age groups, regions, and even browser types can reveal friction points that a single aggregate number would never surface, from a payment method that's less familiar in one region to a form field that confuses one age group more than another.
New versus returning visitor segmentation deserves its own permanent spot in every report, given how consistently returning visitors outperform new ones. Segmenting by visitor status also protects your A/B tests from a subtle trap: a test that shows a big aggregate lift might actually be masking a loss among new visitors offset by a gain among returning ones. Always break results down by segment before declaring a winner, because an average can hide two contradictory stories happening at once.
The Role of UX Design in Conversion Rate
User experience design determines whether a visitor's intent survives contact with your site. Every extra click, every unclear label, and every slow-loading element gives a visitor one more reason to leave before converting.
Visual hierarchy does a lot of the heavy lifting here. A page where the eye is guided naturally toward one clear action outperforms a page competing for attention with five different offers. This is why a single, well-placed CTA consistently beats a page cluttered with secondary buttons and competing links.
Form design deserves special attention because it's where UX friction is most visible in the data. Every field you remove from a signup or checkout form is one fewer chance for a visitor to hesitate, get distracted, or simply give up. Inline validation, clear error messages, and auto-fill support all reduce the cognitive load of completing a form, and that reduced friction shows up directly in completion rates.
Trust and credibility signals round out the UX picture. Visible security badges at checkout, clear return policies, and specific customer proof all reduce the hesitation that shows up as cart abandonment or form abandonment. None of this replaces a strong offer, but weak UX can quietly undermine even a genuinely good one. Our landing page design guide covers the specific layout patterns that tend to perform best.
Customer Journey Stages and Their Effect on Conversion Rate
Conversion rate looks completely different depending on where in the journey you measure it, and treating every stage the same way is a common source of confusion.
Top-of-funnel visitors, often arriving from organic search or display ads, are usually still researching. Expecting a high conversion rate at this stage, especially for a considered purchase, sets an unrealistic bar. The right micro-conversion here might be a newsletter signup or a guide download, not a purchase.
Mid-funnel visitors, who've engaged with content or added something to a cart, show intent but haven't committed. This is where retargeting, email nurture, and clear next-step CTAs earn their keep, and it's also where a lot of the "easy win" testing opportunity lives because these visitors already know who you are.
Bottom-of-funnel visitors, arriving via a branded search, a direct email link, or a return visit to checkout, convert at the highest rates in almost every dataset, which explains why email and returning-visitor traffic consistently top the channel benchmarks. Treating a bottom-funnel visitor with the same messaging as a first-time researcher wastes the trust they've already built with your brand, so map your CTAs and content to the stage the visitor is actually in rather than a one-size-fits-all funnel.
Personalization and Dynamic Content as Conversion Levers
Generic pages ask every visitor to do the mental work of translating a broad message into their specific situation. Personalization removes that step.
Dynamic keyword insertion is one of the simplest forms of this: a landing page headline that mirrors the exact search term or ad copy a visitor clicked reduces the cognitive gap between intent and message, and that alignment alone tends to lift conversion because the visitor feels immediately understood. Matching a paid search ad's promise word-for-word on the landing page it points to is a small technical change with outsized impact on trust.

Beyond keyword matching, dynamic content can adjust based on referral source, geographic location, or return-visitor status. A visitor coming back for a third time doesn't need the same introductory messaging as a first-time visitor, and showing them something more advanced or more direct respects the stage they're actually in.
The tradeoff is complexity. Highly personalized pages require more setup, more testing, and more content variations to manage, which is exactly the kind of work a no-code visual editor with built-in dynamic keyword insertion is meant to simplify: swap the manual, developer-dependent version of personalization for something a marketer can build in an afternoon. Segment-specific offers, urgency messaging tied to actual inventory, and location-aware pricing all fall into this same category of small, targeted changes that compound over many visitors rather than one dramatic redesign.
Why Benchmarks Alone Won't Fix Your Conversion Rate
Most guides on this topic stop at the benchmark table, as if knowing that SaaS converts around 1.5% and home services converts near 8% tells you what to do next. It doesn't. A benchmark tells you whether you're in a reasonable range for your category. It says nothing about which lever to pull.
The conventional advice, "test everything," is where I think most CRO programs actually go wrong. Testing everything with equal weight guarantees you spend real traffic and real time on low-impact ideas. The prioritization math matters more than the testing tool you use. Impact times confidence times ease is not a formality, it's the difference between a program that compounds and one that produces a folder of inconclusive tests.
If I had to pick one place to start for most businesses reading this, it's traffic mix before page design. A site converting new visitors at half the rate of returning ones has a retention and nurture problem, not necessarily a page problem. Fix the denominator you're feeding into your funnel before you spend another quarter redesigning the funnel itself.
— Juan
Turn Benchmarks Into Real Lift
Reading benchmark tables tells you where you stand. Running tests is what actually moves the number. Gostellar gives you a no-code visual editor to build variations without a developer queue, dynamic keyword insertion to match landing pages to ad intent automatically, and a 5.4KB script that won't slow down the page you're trying to improve. Advanced goal tracking and real-time analytics mean you're not waiting a week to know whether your headline test is working. If your team is under 25,000 monthly tracked users, you can start on the free plan and run your first prioritized test this week instead of next quarter.
Sources
- Conversion Rate Optimization Statistics: 2026 Benchmarks From Real A/B Tests
- Conversion Rate Benchmarks 2026 | Benchmarketing
- Conversion Rate Benchmarks - Search Engine Land
Recommended
Published: 9/1/2026