
Ecommerce Conversion Rate: 2026 Benchmarks and Tactics
TL;DR:
- Ecommerce conversion rates average around 1.9% to 2%, with top-performing stores exceeding 4.7%.
- Focusing on checkout trust, mobile experience, and funnel-stage improvements delivers the highest ROI in conversion optimization.
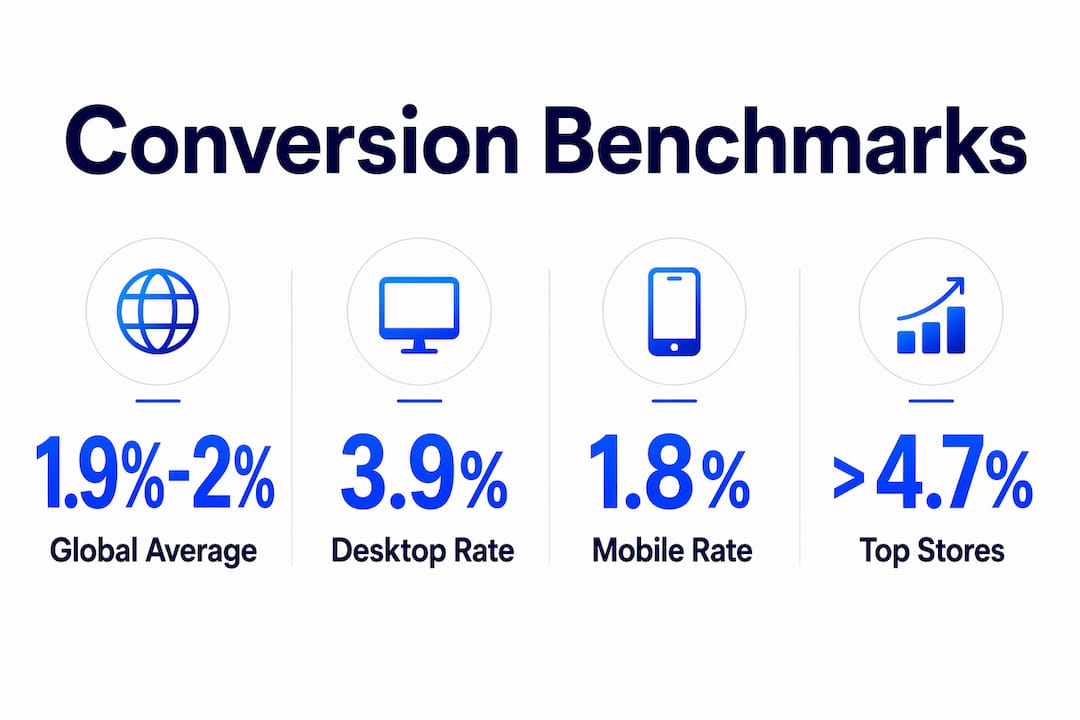
Ecommerce conversion rate is defined as the percentage of store visitors who complete a purchase, calculated as (purchases ÷ unique visitors) × 100. It is the single metric that determines whether your traffic investment pays off or bleeds budget. Globally, conversion rates average 1.9 to 2%, with Shopify stores reaching 2.5 to 3% and top performers clearing 4.7%. Tools like Google Analytics, Fullstory, and research from the Baymard Institute form the measurement backbone most serious ecommerce teams rely on.
What are typical ecommerce conversion rate benchmarks?
The global average conversion rate sits between 1.9% and 2%, but that number alone tells you very little. What matters is where you fall in the distribution. The top 20% of stores convert above 3.2%, and the top 10% exceed 4.7%. If your store sits at 1.5%, you are not failing. You are in the majority, and there is a clear ceiling to aim for.
Device type creates one of the sharpest splits in conversion data. Desktop users convert at 3.9% versus mobile's 1.8%. That gap does not mean mobile shoppers are less motivated. It means the mobile experience still creates enough friction to push purchases to later or to another device entirely.

Industry and region add further layers. Fashion and apparel typically convert below 2%, while health and beauty stores often reach 3% or higher. European markets tend to outperform North American averages in certain verticals due to higher trust in digital payments. Use these benchmarks as directional signals, not fixed targets.
Here is how to interpret your current rate against the distribution:
- Below 1%: Significant funnel or trust issues. Prioritize checkout and product page audits immediately.
- 1% to 2%: Near average. Incremental gains from checkout and mobile optimization will move the needle.
- 2% to 3.2%: Performing well. Focus on average order value and post-purchase upsells.
- Above 3.2%: Top-tier performance. Protect it through continuous testing and do not let complacency erode gains.
| Benchmark tier | Conversion rate | Strategic focus |
|---|---|---|
| Bottom 50% | Below 1.9% | Checkout friction, trust signals |
| Average | 1.9% to 2.5% | Funnel drop-off analysis |
| Top 20% | Above 3.2% | AOV growth, retention |
| Top 10% | Above 4.7% | Personalization, loyalty |
How does the ecommerce funnel affect where you should focus?
The ecommerce funnel runs from discovery through product exploration, add-to-cart, checkout initiation, and purchase completion. Most teams obsess over the top of the funnel when the real money is lost at the bottom. Checkout abandonment averages 70.22%, making it the single largest leak in any ecommerce funnel.
Fixing that leak requires more than gut instinct. Quantitative funnel data from Google Analytics or Fullstory tells you where users drop. Qualitative data tells you why. Session replays, rage click maps, and scroll abandonment heatmaps reveal the specific friction points that aggregate numbers hide. A behavioral analytics approach that combines both layers consistently outperforms teams that rely on page-level metrics alone.
The CRO cycle that produces compounding results follows four steps:
- Measure the funnel stage by stage, segmented by device and traffic source.
- Research the drop-off using session replays, heatmaps, and user surveys at the point of exit.
- Experiment with a single change per test to isolate the variable driving the result.
- Iterate based on what the data confirms, then move to the next highest drop-off stage.
This cycle works because it forces prioritization. Teams that skip step two and jump straight to experimenting often run tests on the wrong pages entirely.
Pro Tip: Set up funnel visualization in Google Analytics 4 with each checkout step as a distinct event. When you see a 40%+ drop between cart and checkout initiation, that is your first test target, not your homepage banner.
Why checkout optimization delivers the highest conversion lift
Checkout is not just a UX problem. Checkout abandonment is a trust architecture failure, rooted in when and how cost information reaches the buyer. Unexpected extra costs revealed late in the process cause approximately 48% of cart abandonments. Forced account creation drives another 26% of abandonment. These are structural problems that no button color test will fix.
Trust architecture means building cost transparency into the product and cart pages, not just the checkout screen. When a shopper sees the total landed cost including shipping and tax before they click "proceed to checkout," the psychological contract is intact. When they see a $12 shipping fee appear on step three of five, the contract breaks and they leave.
"Checkout abandonment is not a checkout problem. It is a product page and cart page problem that manifests at checkout." — WebMarv forensic checkout audit findings
The fixes that move conversion rates most reliably include:
- Show total cost early. Display estimated shipping on the product page or in the cart, not at checkout.
- Enable guest checkout prominently. Place it above the account creation option, not below it.
- Reduce form fields. The optimal checkout has 7 to 8 fields across 2 to 3 steps. The average store uses 11.3 fields across 5.1 steps.
- Add trust badges near payment fields. Norton, McAfee, and SSL indicators placed at the payment step reduce anxiety at the highest-stakes moment.
- Offer express checkout options. Shop Pay, Apple Pay, and Google Pay remove the form entirely for returning users.
Optimizing checkout UX alone can increase conversion rates by up to 35.26%. That is not a marginal gain. For a store doing $500,000 per month, a 35% lift means $175,000 in recovered revenue without a single new visitor.
Pro Tip: Audit your checkout flow as a first-time guest on a mobile device. Count every tap, every field, and every screen. If it takes more than 3 minutes, you have found your biggest conversion problem.
What makes mobile ecommerce conversions uniquely difficult?
Mobile accounts for nearly 70% of sessions but converts about 74% less than desktop. That ratio has not improved as much as the industry expected, because the problem is not primarily visual. It is behavioral. Many shoppers browse on mobile and buy on desktop, making the conversion event appear on a different device than where the purchase journey began.
This cross-device behavior means that optimizing mobile in isolation produces misleading results. A shopper who browses your product page on an iPhone and completes the purchase on a MacBook looks like a desktop conversion in your analytics. The mobile session that drove the decision gets no credit. Cross-device journey continuity matters more than any individual mobile UI tweak.
Practical mobile optimization priorities, in order of impact:
First, page load speed. Google's Core Web Vitals data consistently shows that a one-second delay in mobile load time reduces conversions by a measurable percentage. Target a Largest Contentful Paint under 2.5 seconds. Second, form friction. Autofill, address lookup APIs like Google Places, and numeric keyboards for phone and card fields reduce input errors and abandonment. Third, express checkout. Shop Pay converts at 1.72x the standard rate overall and 1.91x on mobile, making it the single highest-ROI checkout addition for Shopify merchants.
Pro Tip: Use Contentsquare or Fullstory to track scroll depth and rage taps on your mobile product pages. If users are tapping your "Add to Cart" button repeatedly, the button is either too small or the page is not responding fast enough.
What specific tactics increase ecommerce conversions right now?
Product pages are where purchase intent either crystallizes or dissolves. Clear pricing with no hidden modifiers, at least four product images including one lifestyle shot, and a visible return policy within the page fold all reduce the cognitive load that kills conversions. Social proof in the form of verified reviews from platforms like Yotpo or Okendo placed directly below the product title outperforms reviews buried in a tab.
Shipping thresholds combined with dynamic cart messaging produce a compounding effect. Free shipping thresholds with dynamic messaging increase average order value by 10 to 20% and reduce cart abandonment by 15 to 23%. A message reading "Add $12 more for free shipping" in the cart converts better than a static free shipping banner in the header because it is specific and personal.
Payment method coverage closes the gap between intent and purchase for a significant segment of buyers. Digital wallets including Apple Pay and Google Pay now account for a growing share of online transactions. Buy Now Pay Later options from providers like Afterpay and Klarna reduce the perceived cost barrier for higher-ticket items and consistently lift conversion rates in the $100 to $500 price range.
Post-purchase upsells deserve more attention than most teams give them. An upsell shown on the order confirmation page or in the post-purchase email sequence converts without adding friction to the original checkout. The buyer's credit card is already charged, their guard is down, and a relevant product recommendation at that moment captures revenue that would otherwise require a separate marketing campaign to recover.
For a practical overview of proven conversion tactics organized by funnel stage, the Gostellar blog covers implementation specifics that complement the strategic framework here.
You can also review 2026 benchmark data and tips to calibrate your targets against current industry performance before running your next test cycle.
Key takeaways
Ecommerce conversion rate optimization produces the highest ROI when it targets checkout trust architecture, cross-device continuity, and funnel-stage drop-offs in that order.
| Point | Details |
|---|---|
| Know your benchmark | Global average is 1.9 to 2%; top 10% of stores exceed 4.7%. |
| Fix checkout first | Checkout abandonment at 70%+ is the largest recoverable revenue leak. |
| Show costs early | 48% of abandonment comes from unexpected costs revealed late in the funnel. |
| Mobile drives traffic, not sales | Mobile generates 70% of sessions but converts 74% less than desktop. |
| Test express checkout | Shop Pay lifts mobile conversion at 1.91x the standard rate. |
The case for boring, systematic CRO
I have reviewed conversion programs at dozens of ecommerce businesses, and the pattern is consistent. Teams that run flashy redesigns every 18 months consistently underperform teams that run 3 to 5 focused tests per month on their highest drop-off stages. The redesign feels like progress. The systematic testing actually produces it.
The most common mistake I see is treating mobile optimization as a visual design problem. Teams spend weeks adjusting button sizes and color contrast while their checkout still has 11 form fields and no guest checkout option. The behavioral data from tools like Fullstory and Contentsquare makes the real problem obvious within hours of analysis, but teams skip that step because it feels less creative than a redesign.
Checkout-first prioritization is not glamorous advice. It is, however, the advice that consistently produces 20 to 35% conversion lifts without a single new traffic dollar spent. If your checkout still requires account creation before purchase, that is your entire CRO roadmap for the next 30 days. Fix that one thing before you test anything else.
The web conversion strategies that hold up over time share one characteristic. They are grounded in behavioral evidence, not assumptions about what users prefer. Build your testing program on that foundation and the compounding gains take care of themselves.
— Juan
Run smarter conversion tests with Gostellar
If the tactics in this article have surfaced a list of things you want to test, the next challenge is running those tests without slowing your site or requiring a developer for every experiment.

Gostellar is built for exactly that situation. Its A/B testing platform loads at just 5.4KB, meaning your test script adds no measurable page weight. The no-code visual editor lets you set up checkout page tests, product page variants, and dynamic messaging experiments without touching your codebase. Real-time analytics surface winning variants fast, so you are not waiting weeks to act on results. For ecommerce teams running on Shopify or any other platform, Gostellar removes the technical barrier between a conversion hypothesis and a live test.
FAQ
What is a good conversion rate for ecommerce?
A good conversion rate for ecommerce is 2.5 to 3% for most store types, with the top 10% of stores exceeding 4.7%. Rates above 3.2% place a store in the top 20% globally.
What causes the most cart abandonment?
Unexpected extra costs revealed late in checkout cause approximately 48% of cart abandonment, followed by forced account creation at 26%. Both are structural issues, not interface problems.
How do I calculate my ecommerce conversion rate?
Divide total purchases by unique visitors and multiply by 100. Segment this calculation by device and traffic source to identify where the biggest gaps exist.
Why does mobile convert so much lower than desktop?
Mobile converts about 74% less than desktop because many shoppers browse on mobile and complete purchases on desktop. Optimizing for cross-device continuity produces better results than isolated mobile UI changes.
How much can checkout optimization improve conversions?
Checkout optimization alone can increase conversion rates by up to 35.26%, according to Baymard Institute meta-analysis data. Reducing form fields to 7 to 8 and enabling guest checkout are the two highest-impact changes.
Recommended
Published: 5/30/2026