
E-Commerce Optimization: A/B Testing for Revenue Growth
Most e-commerce teams celebrate when they boost conversion rates, but here's the uncomfortable truth: a higher conversion rate can actually shrink your revenue. When you optimize for conversions alone, you might attract more low-value purchases while scaring away high-ticket buyers. The smarter metric? Revenue per user captures both conversion behavior and order value, revealing what truly drives growth. This guide delivers the frameworks, benchmarks, and actionable A/B testing strategies that leading e-commerce teams use to maximize real business results.
Table of Contents
- What is e-commerce optimization?
- Core A/B testing mechanics for e-commerce
- Key e-commerce metrics: Conversion rate vs revenue per user
- Best practices: Effective experimentation at scale
- Real-world benchmarks and what great looks like
- Common mistakes and expert tips for e-commerce optimization
- Ready to turn A/B test insights into revenue?
- Frequently asked questions
Key Takeaways
| Point | Details |
|---|---|
| Prioritize revenue per user | Measure and optimize for RPU to ensure changes truly increase revenue and not just conversion rate. |
| Test with discipline | Run experiments at adequate traffic and duration using A/B testing best practices for valid, actionable results. |
| Scale your learnings | Compound your ROI by running more tests, learning from both wins and losses, and documenting everything. |
| Focus on high-impact areas | Start with product detail and checkout pages for the largest potential lifts in conversion and revenue. |
What is e-commerce optimization?
E-commerce optimization means systematically improving your site to increase sales, average order value, and overall profitability. You're not guessing what works. You're testing, measuring, and refining based on evidence.
The key levers include:
- Conversion rate (CR): Percentage of visitors who complete a purchase
- Average order value (AOV): How much customers spend per transaction
- Revenue per user (RPU): Total revenue divided by total visitors
A/B testing is the cornerstone methodology for evidence-based improvements. You create two versions of a page, split traffic between them, and measure which performs better. Small changes to product page layouts, checkout flows, or call-to-action buttons can create double-digit performance lifts.
Consider this: average e-commerce conversion rates hover around 2-3%, while top performers hit 5.5%. That gap represents a 120% revenue opportunity for most stores. The difference? Top performers run structured experiments that compound over time.
Pro Tip: Start with your highest-traffic pages. Product detail pages and checkout flows offer the biggest potential impact because even small percentage gains multiply across thousands of visitors.
For a deeper foundation, explore our guide on ecommerce optimization fundamentals to understand the full strategic landscape.
Core A/B testing mechanics for e-commerce
A/B testing splits traffic between two versions: A (control) and B (variant). Half your visitors see the original page, half see your proposed change. You measure which version drives better business outcomes.
Here's how to run valid tests:
- Define your hypothesis: Start with a specific, testable prediction based on user behavior or analytics data
- Set sample size requirements: Plan for 10,000-100,000 unique visitors per variant for reliable results
- Determine run duration: Tests should run 2-8 weeks to capture meaningful behaviors and avoid weekly fluctuations
- Choose your primary metric: Use ARPU or RPU instead of just conversion rate to spot real business impact
- Calculate statistical significance: Target 95%+ confidence using Bayesian or Frequentist methods
- Analyze and implement: Roll out winners, document learnings from all tests
The math matters. If you stop a test too early, you might declare a winner based on random chance rather than genuine performance. Running tests through complete business cycles (including weekends and promotional periods) gives you trustworthy data.
| Test Element | Minimum Requirement | Optimal Target |
|---|---|---|
| Sample size per variant | 10,000 visitors | 50,000+ visitors |
| Test duration | 2 weeks | 4-8 weeks |
| Statistical confidence | 90% | 95%+ |
| Primary metric | Conversion rate | Revenue per user |
Popular tools for SMBs include VWO, Convert, and no-code solutions that let marketers launch tests without developer resources. The right platform depends on your traffic volume, technical capabilities, and budget.
Pro Tip: Document every test, even the ones that fail. Your testing history becomes institutional knowledge that prevents repeated mistakes and reveals patterns across experiments.
Learn more about implementing these mechanics in our A/B testing strategies for ecommerce and review A/B testing best practices for detailed execution guidance.
Key e-commerce metrics: Conversion rate vs revenue per user
Conversion rate tells you how many visitors buy. Revenue per user tells you how much money those visitors generate. The distinction matters more than most teams realize.
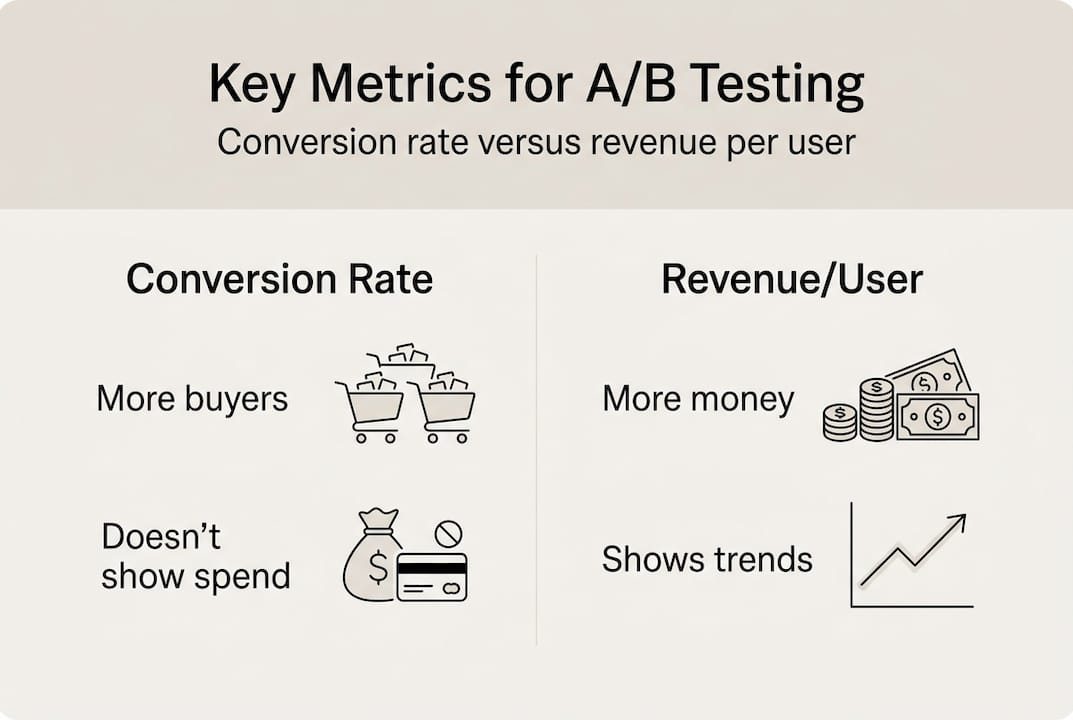
Conversion Rate (CR): Measures the percentage of visitors who complete a purchase. It's important, but it can mislead you. A test might boost CR by 15% while actually reducing revenue if the new design attracts bargain hunters who buy low-margin items.
Revenue Per User (RPU): Measures actual revenue for each visitor. This metric captures both conversion rate shifts and average order value changes. A test winning on CR but losing on RPU can actually reduce business growth.
Here's a real scenario:
- Test A (Control): 2.5% conversion rate, $80 average order value, $2.00 RPU
- Test B (Variant): 3.0% conversion rate, $60 average order value, $1.80 RPU
Test B wins on conversion rate but loses on revenue. If you optimize for CR alone, you'd implement a change that shrinks your business by 10%.
Best-in-class teams now track RPU as the primary KPI for experiments. They still monitor CR and AOV, but they make decisions based on total revenue impact.
| Metric | What It Measures | When It Misleads |
|---|---|---|
| Conversion Rate | Purchase completion percentage | When AOV drops significantly |
| Average Order Value | Revenue per transaction | When conversion rate plummets |
| Revenue Per User | Total revenue per visitor | Rarely (most comprehensive) |
"Focusing solely on conversion rate is like judging a sales team only by how many calls they make, ignoring whether those calls generate revenue. RPU gives you the complete picture."
This shift in thinking separates growing stores from stagnant ones. For more on measurement strategies, check our A/B testing best practices guide.
Best practices: Effective experimentation at scale
Running one test per quarter won't move the needle. Effective optimization requires velocity, discipline, and smart prioritization.

Build strong hypotheses: Every test should start with a clear prediction grounded in user behavior or analytics data. "We believe changing the CTA color from blue to orange will increase clicks by 10% because heat map data shows users focus on that area" beats "Let's try orange and see what happens."
Run parallel tests strategically: You can run multiple tests simultaneously on non-overlapping pages for faster insights. Test your product page layout while simultaneously testing your checkout flow. Just avoid testing two elements on the same page, which creates data pollution.
Segment for bigger wins: Break results down by device type, traffic source, or customer segment. A change might hurt desktop users while helping mobile visitors. Segmentation reveals these patterns and lets you implement targeted solutions.
Maintain testing velocity: Aim for 4-8 meaningful tests per month. More frequent testing compounds learnings over time. Each experiment teaches you something about your customers, even when it doesn't produce a winner.
Accept the win rate reality: Industry data shows only 20-35% of tests produce statistically significant wins. That's normal. The other 65-80% still provide actionable knowledge about what doesn't work.
Prioritize high-traffic pages: Focus on product detail pages, category pages, and checkout flows. These pages see the most visitors, so improvements here create outsized lifts in overall performance.
Pro Tip: Create a testing roadmap that balances quick wins with strategic bets. Run simple tests (button colors, headline variations) alongside complex experiments (new checkout flows, personalization engines) to maintain momentum while pursuing breakthrough improvements.
Explore winning A/B test ideas and browse ecommerce test idea examples for specific experiments you can launch this month.
Real-world benchmarks and what great looks like
Context matters. Knowing whether your 2.8% conversion rate represents success or underperformance requires industry benchmarks.
Average store CR sits at 2-3%, while top performers reach 5.5%. That gap represents a 120% revenue opportunity for most SMBs. Shopify stores average 1.4-1.8% CR, with the best reaching 3.2%.
Specific test types deliver predictable ranges:
- Product detail page tests: Often deliver 8-22% conversion lifts
- Checkout optimizations: Yield 10-35% improvements
- Homepage experiments: Typically produce 5-15% gains
| Store Type | Average CR | Top Performer CR | Improvement Opportunity |
|---|---|---|---|
| General E-commerce | 2.0-3.0% | 5.5%+ | 83-175% |
| Shopify Stores | 1.4-1.8% | 3.2%+ | 78-129% |
| Fashion/Apparel | 1.5-2.5% | 4.0%+ | 60-167% |
| Electronics | 1.0-2.0% | 3.5%+ | 75-250% |
About 40% of e-commerce stores run A/B tests, but only the best track ARPU for compounding wins. The testing itself matters less than what you measure and how you act on results.
Pro Tip: Compare yourself to similar stores in your vertical and traffic tier, not to Amazon or other giants with different business models and resources.
For platform-specific guidance, review Shopify conversion benchmarks and learn strategies for increasing online sales with A/B testing. You can also explore comprehensive 2026 A/B testing benchmarks for deeper industry context.
Common mistakes and expert tips for e-commerce optimization
Even experienced teams make costly errors that undermine their testing programs. Avoid these pitfalls:
Relying only on CR instead of RPU: This masks underlying business issues. A variant might convert better while attracting lower-value customers, shrinking your actual revenue.
Stopping tests too soon: Declaring winners after three days yields unreliable data. Always run tests to statistical significance, which typically requires 2-8 weeks depending on traffic.
Running overlapping tests: Testing your product page headline while simultaneously testing the product page layout creates data pollution. You won't know which change drove results.
Choosing MVT over A/B without sufficient traffic: Multivariate testing (testing multiple elements simultaneously) requires exponentially more traffic than simple A/B tests. SMBs should stick with A/B testing until they have massive visitor volumes.
Failing to document experiments: Continuous testing compounds results when you learn from every experiment. Create a testing library that captures hypotheses, results, and insights from all tests, not just the biggest wins.
Ignoring mobile vs desktop differences: A change that works beautifully on desktop might fail on mobile. Always segment results by device type before rolling out winners.
Testing cosmetic changes only: Button colors and headline tweaks matter, but breakthrough improvements come from testing fundamental user experience changes like simplified checkout flows or enhanced product information.
Pro Tip: Build a culture where failed tests are celebrated as learning opportunities. Teams that fear failure run safe, incremental tests that never produce breakthrough results.
For performance-focused optimization, read about conversion techniques and speed to ensure your tests don't slow down your site.
Ready to turn A/B test insights into revenue?
You now understand the frameworks, metrics, and best practices that separate growing e-commerce stores from stagnant ones. The next step is choosing tools and platforms that accelerate your testing velocity without requiring a team of developers.
The right A/B testing platform combines speed, simplicity, and powerful analytics. You need a solution that lets marketers launch experiments quickly, measures the metrics that matter (like RPU), and provides real-time insights for fast decision-making.

Explore our e-commerce optimization platform designed specifically for small to medium-sized businesses that want enterprise-level testing capabilities without enterprise complexity. Or review our guide to no-code A/B testing tools to find the solution that fits your traffic volume and technical resources.
Frequently asked questions
How long should a typical A/B test run on an e-commerce site?
Expect your A/B test to run 2-8 weeks depending on traffic volume to reach statistical significance. Higher traffic sites can conclude faster, while smaller stores need longer durations.
What is a good conversion rate for an e-commerce store?
The average e-commerce conversion rate is 2-3%, with top performers reaching 5.5% or higher. Your target depends on your industry, average order value, and traffic sources.
Why is revenue per user a better metric than conversion rate?
Revenue per user captures both CR and AOV shifts, revealing the full impact of optimization changes. A test can win on conversion rate while losing on revenue if it attracts lower-value purchases.
Can small stores run effective A/B tests?
Yes, but small stores should target high-traffic pages and run tests longer to gather enough data for reliable conclusions. Focus on product pages and checkout flows where traffic concentrates.
How many A/B tests should I run simultaneously?
Run parallel tests on non-overlapping pages to avoid data pollution. Most SMBs can handle 2-4 simultaneous tests across different funnel stages, maintaining velocity without compromising data quality.
Recommended
Published: 3/31/2026