
Ecommerce Performance Metrics That Drive Real Growth
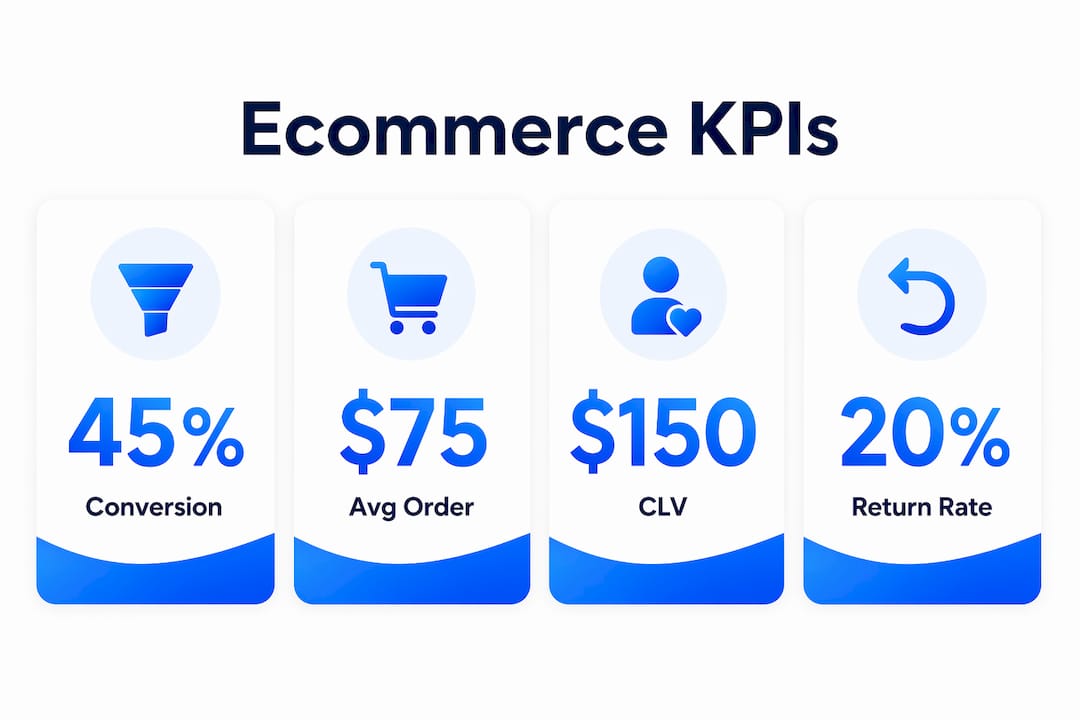
The five ecommerce performance metrics every online store needs to track are Sales Conversion Rate, Average Order Value (AOV), Customer Acquisition Cost (CAC), Customer Lifetime Value (CLV), and Cart Abandonment Rate. Together, these core KPIs give you a balanced read on traffic quality, customer behavior, and financial health without drowning your team in data. Most experts refer to these as the 'Big Five.' Beyond those five, you should also track metrics such as Customer Retention Rate, Return On Ad Spend (ROAS), Net Promoter Score (NPS), and Channel Mix metrics for a more complete performance view. The sections below go deeper on definitions, measurement methods, and how to organize them by business function so each team knows exactly what to watch.
What the core ecommerce performance metrics actually measure
Understanding what each metric tells you, and what it misses, is what separates teams that act on data from teams that just collect it.
Sales Conversion Rate is the percentage of site visitors who complete a purchase. Calculate it by dividing total orders by total sessions, then multiplying by 100. A high conversion rate means your traffic is well-targeted and your checkout experience removes friction. Most online retailers lose 60%–80% of shopping carts before purchase, so even small conversion gains compound quickly.

Average Order Value (AOV) is total revenue divided by number of orders. It tells you how much a typical customer spends per transaction and surfaces cross-sell or upsell opportunities you might be leaving on the table. Track AOV alongside gross margin, not in isolation, because a high AOV with thin margins can still be unprofitable.
Customer Acquisition Cost (CAC) is total marketing and sales spend divided by the number of new customers acquired in the same period. Experienced operators treat CAC as a Tier 1 metric because it directly determines whether your business model is sustainable. A useful benchmark: ideal CLV targets should run at least three times CAC, a 3:1 ratio that signals healthy unit economics.

Customer Lifetime Value (CLV) predicts total revenue from a single customer over their entire relationship with your store. It factors in average order value, purchase frequency, and how long customers stay active. CLV is most useful when compared directly to CAC. The LTV:CAC ratio is an important indicator of business model viability, with higher ratios generally suggesting greater room to invest in growth.
Cart Abandonment Rate measures how often shoppers add items but leave before buying. High abandonment often points to surprise shipping costs, a clunky checkout, or limited payment options. Benchmark it by device and traffic source before making changes, because mobile abandonment and desktop abandonment frequently have different root causes.
Beyond these five, here are the metrics that round out a full picture:
- Customer Retention Rate: percentage of customers retained over a set period; higher retention directly lowers the CAC burden over time
- ROAS: revenue divided by ad spend, tracked by channel to identify which campaigns earn their budget
- NPS: customers rate their likelihood to recommend on a 0–10 scale; scores above 50 are generally considered strong for retail
- Traffic Sources: organic, paid, direct, referral, and social each carry different cost structures and conversion tendencies
- Bounce Rate: the percentage of visitors who leave after viewing only one page; a high rate often flags a mismatch between ad messaging and landing page content
- Session Duration: how long visitors stay active; longer sessions tend to correlate with higher purchase intent, though context matters
- Gross Profit Margin: revenue minus cost of goods sold, expressed as a percentage; the floor beneath every other financial metric
- Refund and Return Rate: the percentage of orders returned; high return rates erode margins and signal product or expectation mismatches
- Inventory Turnover Rate: how quickly you sell through stock; slow turnover ties up cash and raises storage costs
- Mobile vs. Desktop Performance: conversion rates, bounce rates, and AOV often differ sharply by device, making device-level tracking a practical necessity
Tools like Google Analytics 4, Google Search Console, and Shopify Analytics cover most of these out of the box. For tracking ecommerce conversions across channels with more granularity, layering in dedicated analytics platforms gives you the attribution clarity that default dashboards often lack.
How to organize your KPIs by business function
Grouping metrics by business function keeps each team focused on the numbers they can actually influence. When everyone watches everything, nothing gets fixed.
Sales metrics tell you how efficiently your store converts interest into revenue:
- Sales Conversion Rate (overall and by channel)
- Average Order Value
- Gross Profit Margin
- Revenue by channel
- Add-to-cart rate
Marketing metrics reveal whether your acquisition spend is working and where customers come from:
- CAC and CAC payback period
- ROAS by channel
- Traffic sources and attribution
- Click-Through Rate (CTR), Cost Per Click (CPC), and Cost Per Acquisition (CPA)
- Email open rate and email CTR
Monitoring SEO performance sits squarely in this bucket too. Organic traffic is often the lowest-CAC channel, and its contribution to the channel mix deserves its own line in any marketing dashboard.
Finance metrics measure whether growth is actually profitable:
- Gross margin and contribution margin by channel
- Operating profit margin
- Refund and return rate
- Cash conversion cycle
Operational metrics expose the hidden costs that eat into margins:
- Inventory turnover rate
- Stockout impact (lost revenue from out-of-stock items)
- Order fulfillment time
- Shipping costs as a percentage of revenue
Customer experience metrics track loyalty and satisfaction:
- NPS
- Cart Abandonment Rate and recovery rate
- Customer Retention Rate
- Repeat purchase rate
- Ecommerce churn rate
The Big Five KPIs — AOV, Sales Conversion Rate, website traffic, CLV, and Customer Retention Rate — cut across several of these buckets, which is exactly why they work as a quick health check. But a marketing manager optimizing paid campaigns needs ROAS and CTR front and center, while an operations lead needs inventory turnover and fulfillment time. Segmenting by function makes that division of attention explicit rather than accidental.
Pro Tip: Build a single shared dashboard with your Big Five at the top, then add function-specific sections below. Each team sees the company-wide pulse and their own operational detail without wading through irrelevant numbers.
How to choose the right metrics for your specific business goals
The biggest mistake most ecommerce teams make is tracking too much. More data does not produce better decisions. A focused KPI approach improves decision-making speed and lets you pivot quickly based on data rather than chasing generalized vanity metrics.
The practical ceiling is 8–12 KPIs, categorized across sales, marketing, finance, and customer experience. Start with 2–3 per category and expand only as your team gets comfortable acting on the results. A store doing $500K per year does not need the same KPI stack as a $50M operation.
Step 1: State your goal first. Choosing KPIs aligned to a specific goal ensures every metric you track leads to a clear decision. If your goal is revenue growth, lead with Conversion Rate, AOV, and CAC. If your goal is retention, lead with CLV, Repeat Purchase Rate, and Churn Rate. Mixing goals into one KPI set produces noise.
Step 2: Match the metric to the business model. A subscription box store lives and dies by churn rate and CLV. A high-ticket, low-frequency retailer cares more about CAC payback period and gross margin per order. A marketplace model needs channel-level ROAS and revenue attribution. The metric that matters most depends on how your store makes money.
Step 3: Set review cadences by metric type. Not every number needs daily attention. A practical schedule:
- Daily: site traffic, conversion rate, revenue — operational signals that flag problems fast
- Weekly: AOV, CAC, ad spend performance — tactical metrics that inform short-term adjustments
- Monthly: CLV, churn rate, gross margin by channel — strategic trends that guide planning
Step 4: Align KPIs to business maturity. New stores should prioritize traffic and conversion rate first. Once you have consistent volume, shift attention to CAC and CLV. Established brands with strong acquisition can focus on retention and margin optimization. Chasing CLV optimization before you have enough repeat-purchase data is a common early-stage mistake.
Step 5: Drop metrics that don't connect to decisions. Page views, social media followers, and email list size are interesting but rarely drive action on their own. If a metric doesn't change what you do next, cut it from your active dashboard.
Pro Tip: For goal tracking in ecommerce, tie each KPI to a specific threshold that triggers action — for example, "if CAC rises above $X for two consecutive weeks, pause the underperforming ad set." Thresholds turn passive monitoring into a decision system.
Operational metrics that quietly make or break your margins
Good sales numbers can mask a leaking business. Operational and fulfillment metrics are where profitable scaling separates from unprofitable scaling, and most ecommerce dashboards underweight them.
Inventory Turnover Rate measures how many times you sell through your average inventory in a given period. Slow turnover ties up working capital and raises storage costs. Fast turnover with poor forecasting leads to stockouts, which carry their own revenue cost. The goal is a rate calibrated to your category and supplier lead times, not just "higher is better."
Stockout Impact is the revenue lost when a product is out of stock. Most stores don't track this explicitly because the lost sale never appears in the data. Estimating it requires comparing traffic and add-to-cart rates for out-of-stock SKUs against their historical conversion rates. The gap is usually larger than expected.
Order Fulfillment Time covers the window from purchase to delivery. Customers increasingly treat fast shipping as a baseline expectation rather than a differentiator. Slow fulfillment drives negative reviews and suppresses repeat purchases, two effects that show up in NPS and retention data weeks after the fact.
Refund and Return Rate directly erodes gross margin. A 20% return rate on a product with a 40% gross margin can cut realized margin nearly in half once you factor in return shipping and restocking costs. Track return rate by product category and by traffic source, because returns often cluster around specific acquisition channels that attract mismatched buyers.
Website Speed and Core Web Vitals affect conversion rate more directly than most teams realize. Slow load times increase bounce rate, and mobile users are especially sensitive. Google's Core Web Vitals (Largest Contentful Paint, Cumulative Layout Shift, Interaction to Next Paint) are measurable benchmarks that connect directly to both search rankings and on-site conversion. Running A/B tests on page speed improvements, the kind Gostellar's lightweight 5.4KB script is built for, lets you quantify the conversion lift from each technical change rather than guessing.
Mobile vs. Desktop Performance deserves its own reporting segment. Conversion rates, AOV, and bounce rates frequently diverge by device. A store with strong desktop conversion but poor mobile conversion is leaving a growing share of revenue on the table, given that mobile commerce continues to take a larger portion of total online sales each year.
NPS and Cart Abandonment Recovery round out the customer experience side of operations. NPS and Cart Abandonment Rate are critical indicators of long-term ecommerce profitability. Cart abandonment recovery, through email sequences or retargeting, turns a lost sale into a second chance. The recovery rate on those sequences is itself a metric worth tracking separately from the raw abandonment rate.
Pulling these operational numbers into your regular review cycle, alongside sales and marketing KPIs, gives you the full picture that ecommerce analytics tools alone can't provide without deliberate setup. The stores that scale profitably are the ones that treat fulfillment and inventory data with the same rigor they apply to conversion rate.
Key Takeaways
The most effective approach to ecommerce performance metrics is to track a focused set of 8–12 KPIs aligned to specific business goals, organized by function, and reviewed on cadences matched to each metric's strategic importance.
| Point | Details |
|---|---|
| Start with the Big Five | AOV, Sales Conversion Rate, Customer Acquisition Cost (CAC), CLV, and Cart Abandonment Rate form the core health check for most stores, as recommended by ecommerce experts. |
| Cap your KPI count | Track 8–12 KPIs across sales, marketing, finance, and customer experience to avoid analysis paralysis. |
| Match cadence to metric type | Review traffic and conversion daily, AOV and CAC weekly, and CLV and churn monthly for the right signal-to-noise ratio. |
| Prioritize unit economics first | The LTV:CAC ratio above 3:1 signals a sustainable business model before you optimize for conversion tactics. |
| Don't ignore operational metrics | Inventory turnover, return rate, and fulfillment time directly affect margins even when top-line sales look healthy. |
Recommended
Published: 7/18/2026