
When Statistically Significant Results Shouldn't Make Marketers Ship
A result is statistically significant when the p-value falls at or below a pre-set alpha, usually 0.05 or 0.01, giving you enough evidence to reject the null hypothesis at that error rate. That's the whole verdict: not proof, not importance, just a threshold cleared. A drug can be statistically significant and clinically meaningless. A marketing test can hit p = 0.01 and still not be worth shipping. The number tells you the result probably wasn't random noise. It doesn't tell you whether you should care.
TL;DR:
- A significance test's p-value indicates how likely the observed data would occur if there was no true effect, but it does not measure the effect’s importance or practical value.
- Choosing the alpha threshold (commonly 0.05 or 0.01) before testing is essential; switching to a more lenient threshold after viewing the data constitutes p-hacking.
- Statistical significance depends solely on the p-value and does not guarantee the effect is large enough to justify action or investment.
- Sample size influences results: small samples may miss real effects, while very large samples can flag trivial differences as significant, requiring effect size evaluation.
- Reporting should include the p-value, effect size, confidence interval, sample size, and alpha threshold to allow proper interpretation and application of the results.
Table of Contents
- What "Statistically Significant" Actually Means
- How to Run a Significance Test, Step by Step
- Real Examples of Statistically Significant Results
- Statistical Significance vs. Practical Significance
- Where Significance Testing Goes Wrong
- How to Report a Statistically Significant Result
- Applying This to Marketing A/B Tests
- A Working Editor's Take on Acting on Significant Results
- Sources
- FAQ
What "Statistically Significant" Actually Means
Every significance test starts with two competing claims: the null hypothesis (nothing changed, no difference exists) and the alternative hypothesis (something did change). You're never proving the alternative true. You're checking whether your data would be unusual if the null were true, and deciding whether that's unusual enough to walk away from it.
The p-value is that "how unusual" number. It's the probability of seeing data at least as extreme as what you got, assuming the null hypothesis were actually correct. It is not the probability the null hypothesis is true, and it's not the odds your finding will replicate. People confuse this constantly.
The decision itself is binary, which is both the point and the problem:
- If p ≤ alpha, you reject the null and call the result statistically significant.
- If p > alpha, you fail to reject the null. That's not the same as proving there's no effect.
- Common alpha thresholds are 0.05 and 0.01, chosen before you look at the data, not after.
- The verdict says nothing about whether the effect is large, useful, or worth acting on.
How to Run a Significance Test, Step by Step
Testing for statistical significance follows a fixed sequence, and skipping steps is how people end up fooling themselves.
- Set alpha and write your hypotheses first. Decide on 0.05, 0.01, or something stricter before collecting data, and state your null and alternative hypotheses in advance.
- Pick the right test. A two-sample t-test compares two group means (drug vs. placebo, variant A vs. variant B). A chi-square test handles categorical outcomes like click versus no-click. A randomized controlled trial design underlies most clinical and product experiments.
- Compute the test statistic and p-value. Software like R, Python's SciPy, or a built-in A/B testing calculator does the arithmetic; you supply the means, standard deviations, and sample sizes.
- Compare p to alpha and apply your decision rule. A two-tailed test checks for any difference in either direction; a one-tailed test checks only for an increase or only a decrease, which changes how you split your significance threshold.
- Check your sample size and statistical power before trusting the result. Underpowered tests miss real effects; oversized samples can flag trivial ones as significant.
Pro Tip: Pick one-tailed versus two-tailed before you see the data, not after. Switching to a one-tailed test once you notice your result leans one direction is a quiet form of p-hacking, and it inflates your false-positive rate without you realizing it.
Real Examples of Statistically Significant Results
Numbers make this concrete faster than any explanation. Here are three examples of statistical significance drawn from different fields, each showing the mechanics in action.
Clinical trial: cholesterol reduction. In a randomized trial, the treatment group's LDL cholesterol dropped by an average of 38.2 points, versus 8.4 points for placebo. The t-statistic came out to roughly −9.02, with p < 0.0001, far below a strict alpha of 0.01. That gap is both statistically significant and clinically relevant. A separate worked t-test walkthrough using similar data reports a Cohen's d of 2.55, an effect size large enough that no one needs to argue over whether it matters.

Textbook example: swimmer timing. A classic hypothesis test asks whether a swimmer's new goggles improved her average lap time below a claimed 16.43 seconds. The test produced p = 0.0187 against alpha = 0.05, so the null hypothesis gets rejected. No drama, no ambiguity: 0.0187 is smaller than 0.05, decision made.
That's significant on paper.
A 0.8 percentage point lift sounds small until you multiply it across 100,000 monthly visitors, but the number that actually matters is the confidence interval, not the p-value alone.
If the 95% confidence interval on that lift excludes zero, you have a real but modest effect, and you'd want a large enough sample to trust it before rolling it out everywhere.
Statistical Significance vs. Practical Significance
A p-value tells you whether an effect probably exists. It says nothing about whether the effect is big enough to act on, which is where effect size and confidence intervals come in.
Effect size measures the magnitude of a difference (how many points, how many percentage points, how many seconds). A confidence interval gives you a plausible range for that magnitude, which matters more than the single point estimate. Both fill in what a bare p-value leaves out, since statistical significance is a verdict, not a measure of importance.
- A survey of 500,000 users can find a 0.1% difference in click-through rate statistically significant purely because the sample is enormous, even though nobody would notice that difference in practice.
- A small clinical trial might miss a genuinely useful effect simply because it lacked the power to detect it.
- Marketers should set a minimum worthwhile lift before testing starts. If a 0.3% conversion bump doesn't cover the engineering cost of shipping it, significance alone shouldn't drive the rollout decision.
Where Significance Testing Goes Wrong
The math is reliable. The way people use it usually isn't.
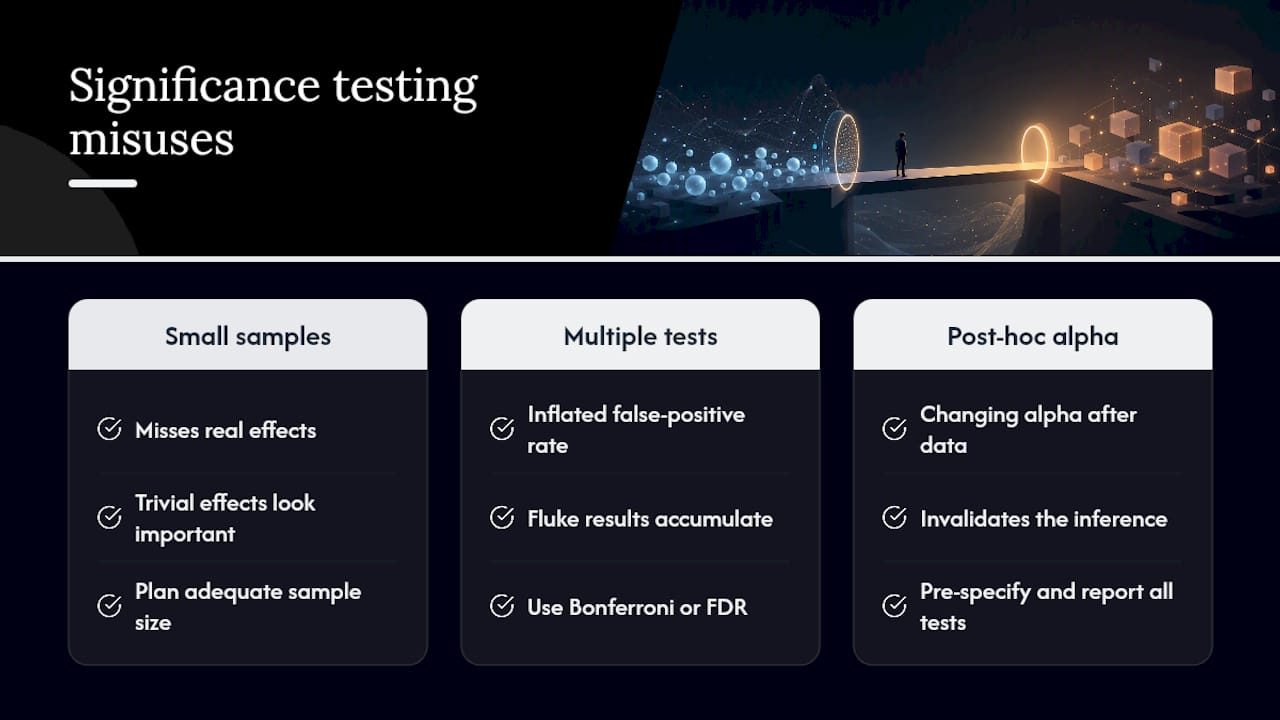
Sample size cuts both ways: too small and you miss real effects, too large and trivial ones look important. Treating a non-significant result as proof of "no effect" is one of the most common misreadings in applied research; it just means you didn't find enough evidence, which isn't the same as evidence of nothing.
Running many tests at once inflates your false-positive rate, since each additional comparison carries its own chance of a fluke result. Corrections like Bonferroni or false discovery rate (FDR) control exist specifically to rein that in. And changing your alpha after seeing the data, rather than locking it in beforehand, quietly invalidates the whole exercise. Pre-specify everything, then report every test you ran, not just the ones that worked.
How to Report a Statistically Significant Result
Reporting significance clearly means giving readers enough to judge the finding themselves, not just a pass/fail stamp.
- For technical audiences, use a template like: "Conversion rate increased from X to Y% (n = [sample size], p = [value], alpha = 0.05), a [magnitude] effect with a 95% CI of [range]."
- For stakeholders, translate it into plain language: what changed, by how much, and whether that change is big enough to matter given the cost of acting on it.
- Always disclose your alpha threshold up front and note if you ran multiple comparisons, so readers can judge how much confidence the result deserves.
Applying This to Marketing A/B Tests
That clears the statistical bar, but the rollout decision still depends on effect size relative to what the change costs to implement.
- Read the confidence interval, not just the p-value, before greenlighting a full rollout.
- Check that your test ran long enough to reach adequate statistical power, so a "win" isn't a fluke of an underpowered sample.
- For a deeper walkthrough of reading test outputs, see this guide on interpreting statistical significance in A/B test results.
A Working Editor's Take on Acting on Significant Results
A significant p-value is an invitation to look closer, not a green light to ship. Check the effect size, look at the confidence interval, and ask whether the cost of rolling something out is justified by what the interval actually promises. If the stakes are high, replicate the test before committing. Pre-specify your alpha, report every test you ran, and treat a single significant result the way you'd treat one good meeting: encouraging, not conclusive.
— Juan
Sources
For the mechanics of testing and interpretation, the NCBI Bookshelf's StatPearls entry on statistical significance is the most practical clinical reference available. OpenStax's introductory statistics text walks through full worked hypothesis tests step by step. The CASRAI guide to statistical significance is a clean conceptual overview for readers who want the framing without the formulas, and Penn State's STAT200 lesson on significance and confidence intervals pairs the two concepts well. Marketers running live tests may also find value in a broader guide to A/B testing significance for CROs and this partner piece on conversion rate optimization.
- Statistical significance - StatPearls - NCBI Bookshelf
- OpenStax — Full hypothesis test examples
- CASRAI guide to statistical significance
- NCBI PMC article on p-value interpretation
FAQ
How Do You Write That a Result Is Statistically Significant?
State the metric, sample size, p-value, and alpha together: "Conversion rate increased with statistical significance (p less than or equal to the chosen alpha, such as 0.05)." Add the effect size or confidence interval so readers can judge whether the change matters beyond clearing the threshold.
What Is a Simple Example of Statistical Significance?
The swim goggles textbook example is a clean one: a test produced p = 0.0187 against alpha = 0.05, so the null hypothesis was rejected. Any case where p falls at or below your pre-set alpha counts as statistically significant.
What Does a P-Value of 0.05 Mean?
It means there's a 5% chance of seeing data this extreme if the null hypothesis were actually true.
Is Statistical Significance the Same as Practical Importance?
No. A result can be statistically significant without being practically meaningful, especially with very large samples where tiny, unimportant differences still clear the p-value threshold. Effect size and confidence intervals tell you whether the difference is worth acting on.
Why Do Researchers Set Alpha Before Running a Test?
Setting alpha in advance keeps the error rate meaningful; changing it after seeing results lets you cherry-pick a threshold that flatters your data. Pre-specifying alpha and your hypotheses is standard practice for keeping a significance test honest.
Recommended
Published: 9/19/2026