
Cut Your Dashboard to 8–12 KPIs: Big Five Metrics for Ecommerce Owners
Five numbers matter more than the rest: conversion rate, average order value, website traffic, customer lifetime value, and retention. Together they form what growth practitioners call the "Big Five," and every other metric on your dashboard should exist to explain a change in one of them. Keep your total dashboard to 8 to 12 KPIs tied to a single business goal. Anything beyond that turns measurement into noise.
TL;DR:
- Conversion rates should be above 2% to 2.5% for average stores, with strong performers exceeding 4%, indicating issues like slow page speed or checkout friction if lower.
- Customer lifetime value must be at least three times higher than acquisition costs to ensure profitable growth, with a target ratio of 3:1.
- Focusing on 8 to 12 core KPIs aligned with specific business goals helps avoid measurement noise and improves decision-making.
- Segmenting metrics by traffic source, device, or customer type reveals specific problem areas, such as mobile checkout issues if mobile conversion drops more than desktop.
- Using lightweight, integrated tools like Stellar for KPI tracking allows real-time adjustments without slowing website performance or requiring extensive developer support.
Table of Contents
- The Most Important Ecommerce Metrics to Track (and How to Calculate Them)
- How Do You Choose Which KPIs to Track?
- What Are Realistic Ecommerce Benchmarks?
- How Should You Segment and Review Ecommerce Metrics?
- Which Tools Should You Use to Track Ecommerce KPIs?
- How Do You Turn Metric Changes Into Action?
- Fewer KPIs, Clearer Decisions
- Try Stellar to Track the Metrics That Actually Move the Needle
- Sources
The Most Important Ecommerce Metrics to Track (and How to Calculate Them)
Most store owners drown in numbers they never act on. Shopify's own survey data found that 77% of store owners track total revenue, but fewer than half regularly check profit margin, traffic, average order value, or conversion rate. That's backwards. Revenue tells you what happened. The metrics below tell you why, and what to fix.
Here are the essential ecommerce performance metrics worth building into any dashboard, with formulas you can drop into a spreadsheet today.
- Conversion rate measures the share of visitors who complete a purchase. Formula: (orders ÷ sessions) × 100. A healthy site typically converts around 2.5% on average, with strong performers clearing 4% or higher, according to benchmark data compiled by Neal Schaffer. If yours sits well under 2%, check page speed, checkout friction, and whether your traffic actually matches your offer.
- Average order value (AOV) shows how much a typical customer spends per transaction. Formula: total revenue ÷ number of orders. When AOV stalls, it usually means weak upsell placement or a pricing ladder with no natural next step.
- Customer lifetime value (CLV or LTV) estimates total revenue from a customer over the full relationship. A simple formula: average order value × purchase frequency × average customer lifespan (in years). A flat or declining CLV points to a retention problem, not an acquisition one.
- Customer acquisition cost (CAC) is total marketing and sales spend divided by new customers acquired in that period. Rising CAC with flat conversion rates usually means your channels are saturated or your targeting has drifted.
- LTV:CAC ratio puts CLV and CAC together into a single profitability signal. The widely cited target is 3:1, meaning each customer should return three times what it cost to acquire them, per Neal Schaffer's benchmark analysis. Below 2:1, you're likely overspending on acquisition relative to what customers are worth.
- Revenue per visitor (RPV) multiplies conversion rate by AOV into one number. It's underused, but it catches a specific blind spot: when conversion rate rises while AOV falls (or vice versa), RPV tells you whether the net effect actually helped. That combination reduces false positives that a single metric would miss.
- Add-to-cart rate tracks the percentage of sessions that result in a product being added to a cart. Formula: (add-to-carts ÷ sessions) × 100. A low rate signals a product page problem, not a checkout problem.
- Cart abandonment rate measures the share of shoppers who add items but never complete checkout. Formula: 1 minus (completed purchases ÷ carts created), expressed as a percentage. The number hovers near 70% across most of ecommerce, based on figures widely cited by Neal Schaffer. If yours runs meaningfully higher, audit shipping costs, payment options, and checkout page length.
- Return rate is returned orders divided by total orders placed. NetSuite lists this among the fundamental metrics every seller should monitor, since a spike often traces back to inaccurate product descriptions or sizing charts rather than product quality itself.
- Return on ad spend (ROAS) is revenue generated from ads divided by ad spend. A ROAS under 3:1 in a thin-margin category often means you're paying to acquire customers who won't be profitable until a second or third purchase.
- Website traffic by channel breaks total sessions into organic, paid, email, direct, and social. Raw traffic alone tells you almost nothing; the split tells you where your growth is actually coming from and which channels are shrinking.
- NPS, email opens, and email click rate round out the customer experience side. NPS surveys ask customers how likely they are to recommend you on a 0 to 10 scale; email opens and clicks show whether your retention channel is still earning attention. ThoughtSpot groups these under customer experience KPIs, distinct from sales and marketing metrics, and recommends tracking them separately so a good sales month doesn't mask a quietly disengaging customer base.
Pro Tip: If two metrics ever seem to contradict each other, check revenue per visitor first. It usually resolves the confusion faster than staring at conversion rate and AOV separately.
How Do You Choose Which KPIs to Track?
A metric and a KPI are not the same thing. A metric is any number you can measure. A KPI is a metric you've deliberately tied to a specific business goal, with a target and an owner attached. Tracking add-to-cart rate is a metric. Tracking add-to-cart rate because you've committed to lifting it by 15% this quarter to fix a leaky funnel makes it a KPI.
Practitioner guidance built around the Big Five suggests 8 to 12 core KPIs, roughly 2 to 3 per major category, is the sweet spot. Fewer than that and you miss real problems; more than that and nobody looks at the dashboard consistently.
Use this four-step framework to build your set:
- Name the goal in plain language. "Scale revenue 20% this year," "improve unit economics so we're profitable by Q3," and "increase repeat purchase rate among existing customers" are three different goals that need three different KPI sets.
- Pick one North Star metric. For a scale-revenue goal, that's often revenue per visitor. For a unit-economics goal, it's the LTV:CAC ratio. For a retention goal, it's repeat purchase rate.
- Pick 3 to 5 input KPIs that directly move the North Star. Scaling revenue might mean tracking traffic by channel, conversion rate, and AOV. Improving unit economics might mean tracking CAC, ROAS, and gross margin per order.
- Pick 2 to 3 diagnostic KPIs that explain why the input KPIs move. Add-to-cart rate and cart abandonment rate diagnose conversion problems. Email click rate and NPS diagnose retention problems.
Then delete everything else from the daily dashboard. You can always pull a deeper report when something looks off. For a fuller framework on balancing short-term sales KPIs against longer-term customer health, see this breakdown of ecommerce performance metrics that drive growth.
What Are Realistic Ecommerce Benchmarks?
Benchmarks are starting points, not scorecards. A 2.5% conversion rate might be excellent for a high-ticket furniture brand and mediocre for a $15 impulse-buy product. Device matters too: mobile traffic typically converts lower than desktop even when it drives more total sessions, which distorts a blended average if you don't segment it out.
The variation caveat matters more than the numbers themselves. NetSuite's guidance is to compare your own metrics against your own prior periods first, then use industry ranges as a sanity check rather than a scoreboard. A jewelry brand and a snack food subscription business will never share a meaningful AOV benchmark, but each can meaningfully track whether this quarter's AOV beat last quarter's.
How Should You Segment and Review Ecommerce Metrics?
A blended number hides the story. Segmenting by channel, device, campaign, new versus returning customer, and cohort window is what turns a metric into a diagnosis. If overall conversion rate drops 10%, but mobile conversion dropped 25% while desktop held steady, you've just found your actual problem: something broke on mobile checkout, not across the whole funnel.
BigCommerce's funnel framework maps different KPIs to different funnel phases, from awareness through advocacy, which is a useful mental model for deciding what to segment and when.
Cadence should scale with how fast a metric moves and how directly you can act on it:
- Daily: traffic and conversion rate, since both respond quickly to site issues, ad changes, or outages.
- Weekly: AOV, CAC, and ROAS, which need enough volume to smooth out day-to-day noise.
- Monthly or quarterly: CLV, retention, and profitability, since these metrics move slowly and overreacting to weekly swings wastes effort.
Which Tools Should You Use to Track Ecommerce KPIs?
Start with your platform's native analytics, whether that's Shopify Analytics, a similar built-in dashboard, or your storefront's reporting suite. Shopify recommends layering GA4 and Search Console on top once organic traffic becomes a meaningful channel, since native analytics rarely break down search intent or landing page performance well.
For real-time operational metrics, ThoughtSpot recommends interactive dashboards (what it calls Liveboards) for numbers like traffic and conversion rate that ops teams need to act on the same day, while reserving quarterly reports for strategic KPIs like CLV.
A few habits keep your reporting trustworthy:
- Standardize UTM parameters across every campaign so channel attribution doesn't fragment into a dozen near-duplicate labels.
- Validate that revenue events fire correctly after every platform update or theme change.
- Pick one source of truth for revenue reporting and treat every other tool as a supporting view, not a competing number.
- Name dashboards and metrics consistently so "conversion rate" means the same calculation everywhere it appears.
- Set automatic alerts on your diagnostic KPIs rather than relying on someone remembering to check.
Guidance on choosing the right measurement stack lives in this walkthrough of KPIs, tools, and measurement tips, which pairs well with a deeper look at ecommerce analytics setups built to catch revenue shifts early.
How Do You Turn Metric Changes Into Action?
A dashboard is only useful if someone owns each number and a process exists to act when it moves. Here's a practical sequence for making that real:
- Assign an owner and a response time to every KPI. If nobody is accountable for cart abandonment rate, nobody will notice when it climbs.
- Write down exactly how each metric is calculated. "Conversion rate" means different things if one report counts sessions and another counts unique visitors.
- Validate your tracking before trusting the numbers. Confirm revenue events fire correctly and UTM tags are applied consistently across every campaign.
- Run A/B tests with one clear primary metric and a guardrail metric. If you're testing a new checkout flow, conversion rate might be the primary metric while AOV serves as the guardrail, so you don't accidentally win on one and lose on the other.
- Set alerts on diagnostic KPIs like add-to-cart rate and cart abandonment rate, and schedule a monthly root-cause review for anything that trips them.
Funnel-level diagnostics like these work best instrumented as discrete events with channel and device dimensions attached, so a drop shows up segmented, not as a mystery blended number.
A lightweight testing script matters more here than it sounds. Heavy analytics tags can slow page load enough to distort the conversion rate you're trying to measure in the first place, so whatever tool handles your A/B tests and goal tracking should add minimal weight to the page. That's a real feature to look for, not a nice-to-have.
Pro Tip: Before you launch a test, write down the one metric that decides whether it wins. If you can't name that metric in a sentence, you're not ready to launch the test yet.
Fewer KPIs, Clearer Decisions
The instinct to track everything comes from a reasonable place: fear of missing something important. In practice, it produces the opposite. Teams staring at 40 metrics on a dashboard tend to act on none of them, because no single number carries enough weight to justify a decision.
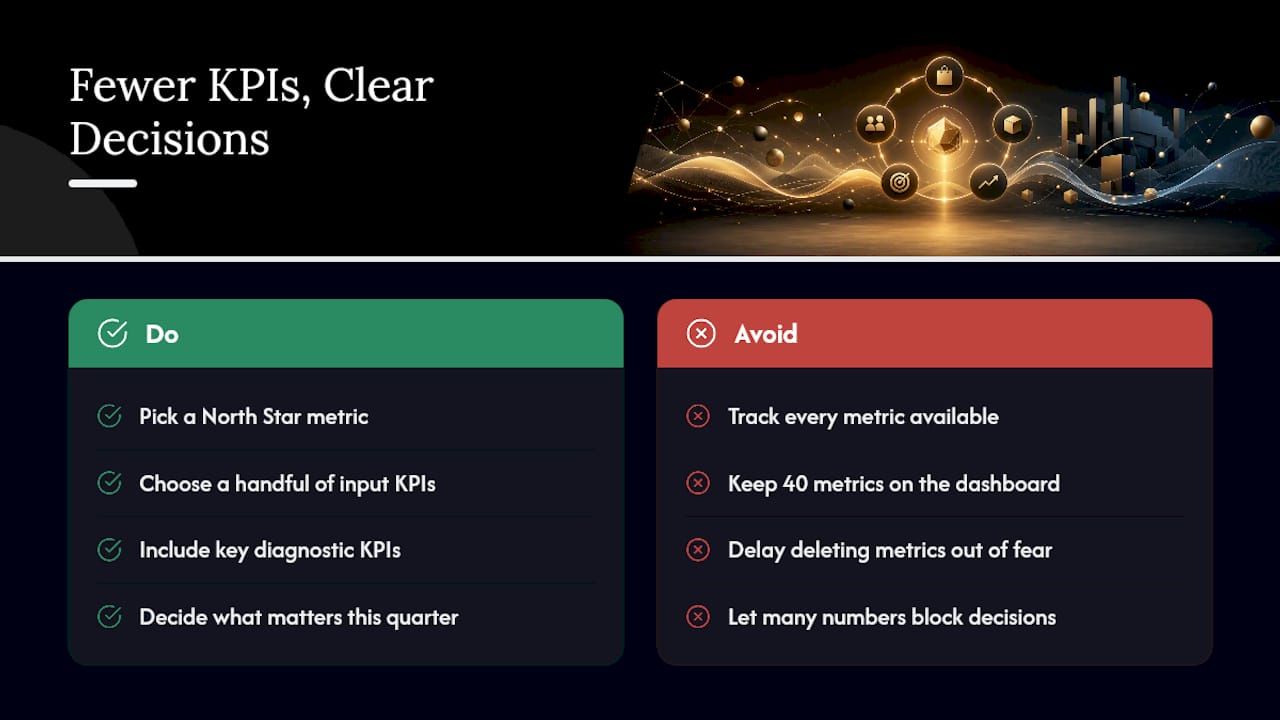
The tighter approach, built around a North Star metric and a handful of input and diagnostic KPIs, forces a different kind of discipline. You have to decide, in advance, what actually matters for this quarter's goal. That decision is uncomfortable, and it's exactly why most teams avoid making it. A store owner who commits to watching revenue per visitor and cart abandonment rate, and ignores the other 30 numbers their platform generates, will usually make faster, better calls than one drowning in a everything dashboard.
The uncomfortable part is deletion, not addition. Cutting a metric from your dashboard feels like losing information. It's usually the opposite.
— Juan
Try Stellar to Track the Metrics That Actually Move the Needle
Once you've settled on your 8 to 12 KPIs, the next problem is instrumenting them without slowing your site down or hiring a developer for every test. Gostellar runs on a script that weighs just 5.4KB, light enough that it won't distort the page speed and conversion numbers you're trying to measure honestly.

The no-code visual editor lets marketers set up A/B tests and goal tracking directly, without waiting on engineering for every experiment. Dynamic keyword insertion personalizes landing pages by traffic source, which feeds cleanly into the channel segmentation this article covers, and advanced goal tracking ties each test directly to the KPI it's meant to move, whether that's conversion rate, add-to-cart rate, or revenue per visitor. Some tools integrate with popular site builders and offer free plans for stores below certain usage thresholds. If your dashboard is finally down to the metrics that matter, start a free trial and put your next test in front of real traffic today.
Sources
- Essential Ecommerce KPIs to Track (2026) - Shopify UK
- 15 Essential e-commerce KPIs and Metrics to Track in 2026
- 10 Vital Ecommerce Metrics to Measure Your Success - NetSuite
- Ecommerce KPIs: 14 Metrics That Actually Predict Growth in 2026
Recommended
Published: 9/7/2026