
Interpreting Testing Results: Unlocking Conversion Wins
Choosing between two digital experiences can feel like guesswork when growth depends on every click. Clarity around A/B testing is vital because even small missteps—like testing multiple elements at once or ignoring sample size—can send your results off track. This guide brings you straightforward answers and highlights data-driven experimentation methods that help smart marketers everywhere turn insights into practical, conversion-focused strategies.
Table of Contents
- Defining A/B Testing and Common Misconceptions
- Types of Experiments and Key Metrics Explained
- How Real-Time Analytics Reveal Actionable Insights
- Statistical Significance and Validating Results
- Avoiding False Positives and Common Pitfalls
- Implementing Insights for Ongoing SaaS Growth
Key Takeaways
| Point | Details |
|---|---|
| A/B Testing Essentials | A/B testing is a structured approach that requires careful experimental design and statistical methods to yield actionable insights for business improvements. |
| Common Misconceptions | Misunderstandings about A/B testing, such as relying on intuition over data or assuming small sample sizes produce reliable results, can hinder effectiveness. |
| Real-Time Analytics Benefits | Implementing real-time analytics enables businesses to make swift data-driven decisions, enhancing competitive advantage through immediate insights. |
| Statistical Significance Understanding | It’s crucial to interpret statistical significance beyond p-values, considering effect sizes and practical relevance to ensure valid conclusions from experiments. |
Defining A/B Testing and Common Misconceptions
A/B testing represents a powerful data-driven approach for making strategic decisions about digital experiences. Continuous experimentation techniques allow businesses to compare two variants of a digital component and determine which performs more effectively.
At its core, A/B testing involves creating two minimally different versions of a webpage, email, or application feature to understand which variant achieves better user outcomes. Key characteristics include:
- Randomly distributing users across control and challenger groups
- Measuring specific, predefined performance metrics
- Making statistically validated comparisons
- Focusing on single-element modifications
Common misconceptions about A/B testing can significantly undermine its effectiveness. Many teams incorrectly assume that:
- Multiple simultaneous component changes provide reliable insights
- Small sample sizes generate meaningful statistical results
- Qualitative assessments can replace quantitative testing
- Intuition trumps data-driven decision making
A/B testing requires rigorous statistical methods and careful experimental design to generate actionable insights.
Professional A/B testing involves clear roles like concept designers, experiment architects, and setup technicians who collaborate to create meaningful experiments. Statistical methods for online controlled experiments are critical for generating reliable results that drive meaningful business improvements.
Pro tip: Always define your success metrics before launching an A/B test to ensure you're measuring what truly matters for your business goals.
Types of Experiments and Key Metrics Explained
Experimental design encompasses multiple approaches for systematically testing hypotheses and measuring digital performance. Experimental design techniques provide structured methods for understanding how different variables impact business outcomes.

Business experiments typically fall into several critical categories:
Here's a comparison of experiment types and their typical business applications:
| Experiment Type | Level of Control | Common Business Use |
|---|---|---|
| Randomized Controlled Trial | High | Product feature changes |
| Quasi-Experiment | Medium | Marketing campaign tests |
| Pre-Experiment | Low | Early concept validation |
| Single-Subject Experiment | Very High (individual) | Personalization analysis |
- Randomized Controlled Trials (RCTs): Gold standard experiments with complete user randomization
- Quasi-Experiments: Scenarios with limited control over variable assignment
- Pre-Experiments: Initial testing phases with preliminary hypothesis exploration
- Single-Subject Experiments: Focused tests targeting specific user segments or behaviors
When designing experiments, organizations must carefully select metrics across six fundamental categories:
- Volume Metrics: Measuring overall user engagement and reach
- Outcome-Based Metrics: Tracking direct business results
- Quality Metrics: Assessing user experience and interaction depth
- Engagement Metrics: Understanding user interaction patterns
- Process Efficiency Metrics: Evaluating operational performance
- Strategic Alignment Metrics: Connecting experiments to broader business goals
Effective experimentation requires precisely defined metrics that align directly with strategic objectives.
Experimental design methods emphasize the importance of controlling extraneous factors while systematically manipulating independent variables. Professional experimenters focus on key performance indicators like conversion rates, revenue impact, and statistical significance to generate meaningful insights.
Pro tip: Always establish clear, measurable success criteria before launching any experiment to ensure actionable and reliable results.
How Real-Time Analytics Reveal Actionable Insights
Real-time analytics transforms raw data into immediate, strategic business intelligence. Real-time data processing enables businesses to capture and analyze data streams instantaneously, creating opportunities for rapid decision-making.
The core capabilities of real-time analytics span multiple critical domains:
- Immediate Insights: Processing data as it's generated
- Contextual Understanding: Providing immediate situational awareness
- Predictive Capabilities: Forecasting trends and potential outcomes
- Personalization: Tailoring experiences based on live data
- Performance Optimization: Continuously adjusting strategies
Key applications demonstrate the transformative power of real-time analytics across industries:
A summary table illustrating key real-time analytics capabilities and benefits:
| Capability | Business Advantage | Example Use Case |
|---|---|---|
| Immediate Insights | Faster response to market changes | Dynamic pricing adjustments |
| Predictive Analysis | Anticipating trends for advantage | Fraud detection alerts |
| Personalization | Enhanced user engagement | Custom product recommendations |
| Performance Tracking | Continuous improvement of processes | Live customer support metrics |
- E-commerce: Dynamically adjusting pricing and recommendations
- Fraud Detection: Identifying suspicious transactions instantly
- Marketing: Personalizing user experiences in milliseconds
- Customer Service: Proactively addressing potential issues
- Product Development: Gathering immediate user feedback
Competitive advantage emerges from the ability to process and act on data faster than traditional methods allow.
Real-time analytics technologies leverage sophisticated tools like IoT sensors, AI models, and distributed computing architectures to enable unprecedented data responsiveness. These advanced systems can process massive data streams, delivering actionable insights that drive strategic decision-making.
Pro tip: Configure your analytics dashboard to highlight anomalies and key performance indicators, ensuring you can spot critical insights within seconds of data generation.
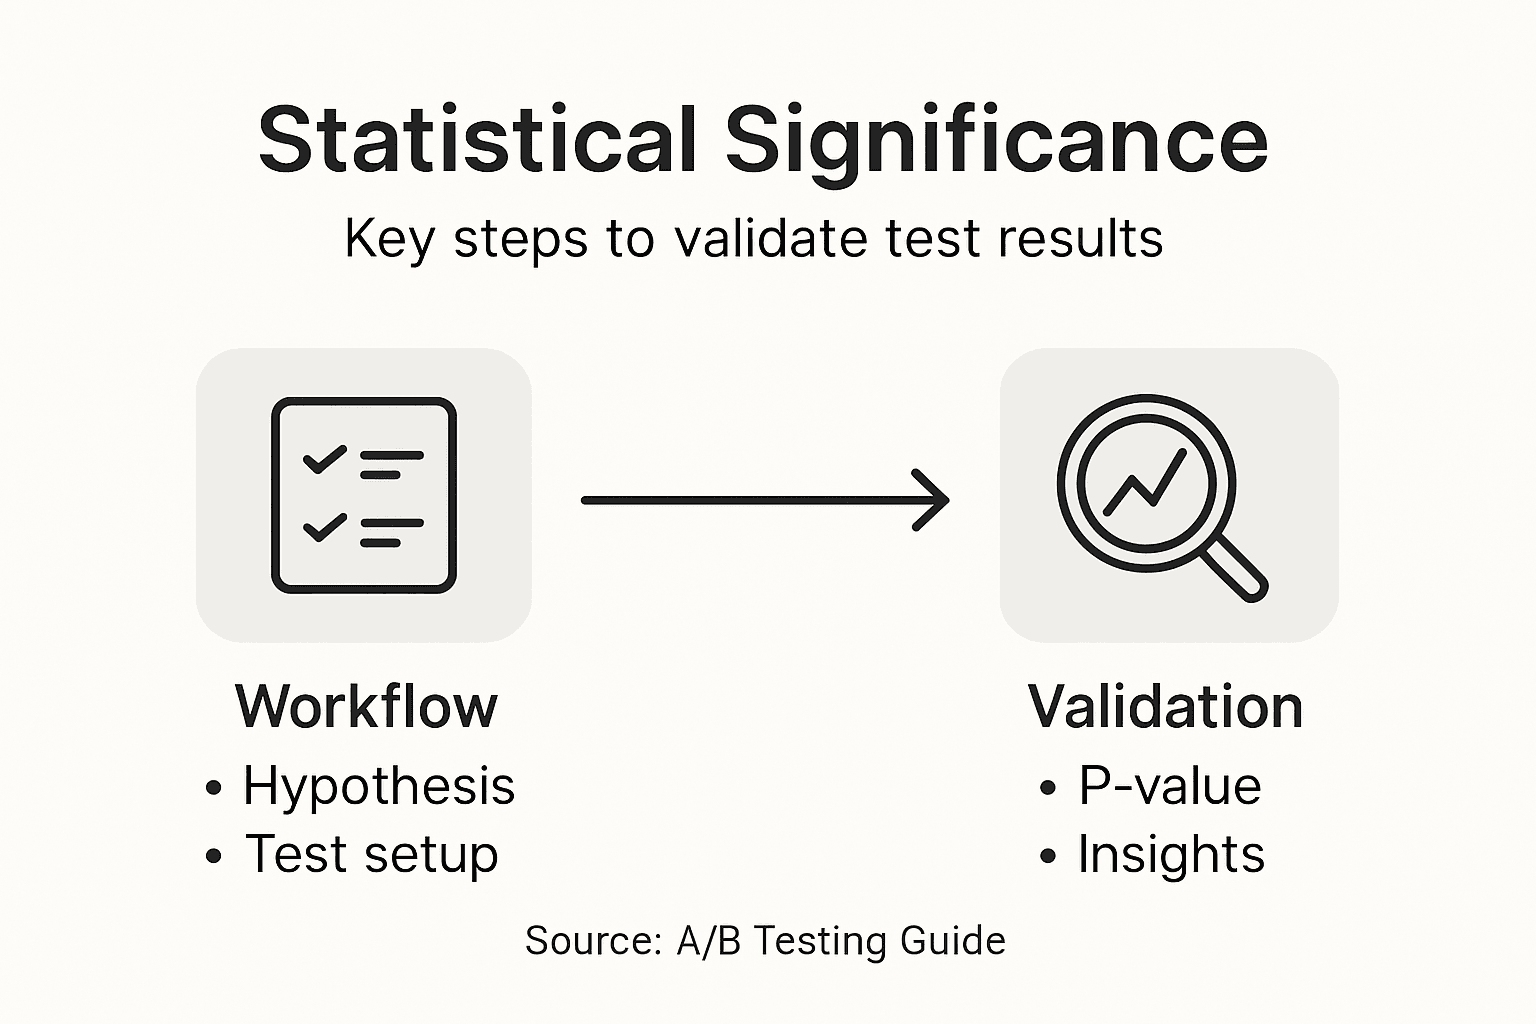
Statistical Significance and Validating Results
Statistical significance transforms raw experimental data into meaningful insights that drive strategic decision-making. Hypothesis testing techniques help researchers distinguish between genuine effects and random variations, providing a structured approach to validating experimental results.
The core principles of statistical significance revolve around several key concepts:
- Null Hypothesis: Assuming no real effect exists
- P-Value: Measuring probability of results occurring by chance
- Significance Level: Predetermined threshold for accepting results
- Effect Magnitude: Understanding practical importance of findings
- Contextual Interpretation: Analyzing results beyond numerical metrics
Professional researchers follow a systematic workflow for validating experimental outcomes:
- Establish clear research hypothesis
- Select appropriate statistical test
- Determine significance threshold (typically 0.05)
- Calculate p-value
- Interpret results within broader context
- Consider practical implications
Statistical significance is not a binary verdict but a nuanced interpretation of experimental evidence.
Hypothesis testing workflows provide structured methods for rejecting or supporting research claims. Critically, professionals understand that a p-value below 0.05 does not automatically validate a hypothesis, but requires comprehensive analysis of effect sizes, practical relevance, and broader scientific context.
Pro tip: Never rely exclusively on p-values; always combine statistical analysis with domain expertise and practical understanding of your experimental results.
Avoiding False Positives and Common Pitfalls
False positives can derail even the most carefully designed experiments, undermining the credibility of your analytical efforts. Rigorous research practices help researchers minimize the risk of drawing incorrect conclusions from experimental data.
Common sources of false positives in testing include:
- Small Sample Sizes: Insufficient data leading to unreliable results
- Multiple Testing: Increasing probability of chance findings
- Selection Bias: Unintentional skewing of experimental groups
- Novelty-Seeking: Overemphasizing unexpected or exciting results
- Improper Statistical Calculations: Misapplying statistical methods
Strategies to mitigate false positives involve a comprehensive approach:
- Preregister research hypotheses
- Use appropriate randomization techniques
- Implement blinding where possible
- Conduct power analysis for sample sizing
- Report complete experimental results
- Encourage independent replication
Statistical significance does not guarantee scientific truth, only a reduced probability of random occurrence.
Avoiding research bias requires meticulous planning and a critical approach to data interpretation. Researchers must balance statistical rigor with practical understanding, recognizing that true scientific insight comes from careful analysis and contextual interpretation.
Pro tip: Always design your experiment with potential biases in mind, and be prepared to critically examine your results beyond simple statistical thresholds.
Implementing Insights for Ongoing SaaS Growth
Data-driven strategies transform experimental insights into sustainable business growth. Big data insights enable SaaS companies to uncover nuanced user behavior patterns and drive continuous improvement.
Successful implementation of testing insights requires a multi-dimensional approach:
- User Behavior Tracking: Monitoring granular interaction patterns
- Predictive Segmentation: Categorizing users for targeted experiences
- Conversion Path Analysis: Understanding critical decision moments
- Churn Signal Detection: Identifying potential customer dropout risks
- Personalization Algorithms: Dynamically adapting user experiences
Key strategies for translating insights into growth include:
- Establish clear performance benchmarks
- Create adaptive user experience frameworks
- Develop continuous learning mechanisms
- Implement real-time feedback loops
- Design iterative improvement processes
- Align insights with broader business objectives
Sustainable growth emerges from consistently translating data insights into meaningful product improvements.
Professional SaaS teams recognize that transforming experimental data requires more than statistical analysis. They combine quantitative insights with deep domain expertise, creating nuanced strategies that drive meaningful user engagement and long-term retention.
Pro tip: Treat every data point as a narrative about user experience, not just a number to be optimized.
Unlock Powerful Conversion Insights with Stellar's Streamlined A/B Testing
Interpreting testing results can be overwhelming when grappling with statistical significance, real-time analytics, and actionable insights. The article highlights common pitfalls like false positives and the challenge of defining clear success metrics. Marketers and growth hackers often struggle with balancing rigorous experimental design and quick, reliable decision-making. Stellar tackles these pain points with a no-code visual editor, advanced goal tracking, and real-time analytics designed to simplify your experimentation process without losing scientific accuracy.

Boost your confidence in every test by using Stellar, the fastest and lightest A/B testing tool built for small to medium businesses. Experience easy setup, dynamic keyword insertion for personalized landing pages, and instant performance metrics that empower you to validate hypotheses and avoid costly errors. Start making data-driven decisions that unlock true conversion wins today by visiting Stellar's A/B Testing Tool. Explore how simplicity meets precision in experimentation at Stellar and take your growth to the next level now.
Frequently Asked Questions
What is A/B testing and how does it work?
A/B testing is a method of comparing two versions of a digital component to determine which one performs better. It involves creating two variants, randomly distributing users, and measuring predefined performance metrics to make statistically valid comparisons.
What are the key metrics to consider in experiments?
Key metrics include volume metrics for user engagement, outcome-based metrics for business results, quality metrics for user experience, engagement metrics for interaction patterns, process efficiency metrics for operational performance, and strategic alignment metrics that connect experiments to business goals.
How does real-time analytics impact decision-making?
Real-time analytics allows businesses to capture and analyze data instantly, offering immediate insights, contextual understanding, predictive capabilities, personalized experiences, and performance optimization, which collectively enhance strategic decision-making and responsiveness.
What is statistical significance and why is it important?
Statistical significance measures the probability that results observed in an experiment are not due to random chance. It is crucial for validating results, ensuring that decisions made based on data are reliable and meaningful.
Recommended
- Proven Steps to Improve Conversions on Your Site
- Choosing Conversion Actions: Drive Better A/B Test Results
- Testing to Optimize Conversions: CRO Strategies for 2025
- How to Set Conversion Goals for A/B Testing Success
- Luxury Prize Company case study | Scaling online ticket sales in the UK
- First Look At New Google Data Studio | MB Web
Published: 2/18/2026