
Testing Analysis for Marketers: A 2026 Practical Guide
TL;DR:
- Effective marketing testing involves designing, executing, and interpreting experiments that link to measurable business outcomes. It relies on statistical standards like A/B testing, multivariate analysis, and user acceptance testing to ensure reliable results. Proper discipline reduces errors, reveals true performance signals, and fosters continuous improvement.
Testing analysis is the structured process of designing, running, and interpreting marketing experiments to produce decisions grounded in data rather than assumption. Done correctly, it connects every test you run to a measurable business outcome. The discipline draws on statistical significance standards, A/B testing methodologies, and user acceptance testing frameworks to separate real performance signals from noise. For marketing professionals, mastering testing analysis is the difference between campaigns that consistently improve and campaigns that just feel like they should.
What are the core types of testing analysis used in marketing?
Three testing methods dominate marketing experimentation: A/B testing, multivariate testing, and user acceptance testing. Each serves a different purpose, and choosing the wrong one wastes traffic and time.

A/B testing is the most widely used method. You split your audience between two versions of a page, email, or ad, then measure which version drives more of your target behavior. It works best when you have a clear hypothesis and enough traffic to reach statistical significance. The 2026 industry standard sets the significance level at 5% (alpha) and statistical power at 80%, with a minimum of 1,000 visitors per variation. Those thresholds exist because anything below them produces results you cannot trust.
Multivariate testing tests multiple elements simultaneously, such as a headline, image, and call-to-action button at once. It identifies which combination of changes performs best. The tradeoff is traffic. Multivariate tests require far more visitors to reach significance because each combination needs its own sample. Most small to medium-sized marketing teams should default to A/B testing until their traffic volume justifies the complexity.
User acceptance testing (UAT) serves a different function entirely. UAT validates business workflow alignment by confirming that a marketing tool, landing page, or campaign system behaves as intended before it goes live. It begins after system testing is complete and requires structured planning, real-world test data, and stakeholder sign-off. For marketers, UAT is the final check before a campaign launches to real audiences.
| Testing type | Primary objective | Sample size need | Typical use case |
|---|---|---|---|
| A/B testing | Compare two versions | Moderate (1,000+ per variation) | Landing pages, email subject lines |
| Multivariate testing | Find best combination | High (varies by combinations) | Page layouts with multiple elements |
| User acceptance testing | Validate workflow | Structured, not volume-based | Pre-launch campaign system checks |
How to design and execute a statistically valid test analysis
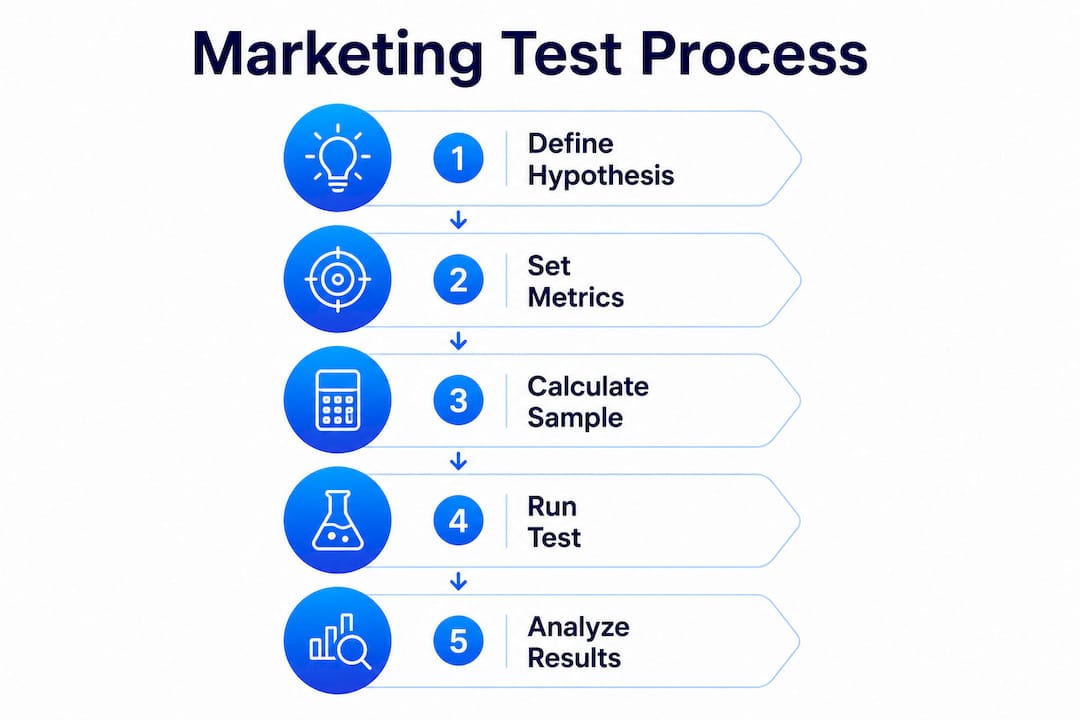
A test without a clear hypothesis is an opinion with extra steps. The hypothesis must name the change, predict the direction of impact, and tie directly to a business metric. "Changing the CTA button color to orange will increase click-through rate" is a testable hypothesis. "Improving the page will help conversions" is not.
Define your metrics before you launch
The single primary metric must connect directly to the business outcome you care about. Changing primary metrics after a test launches introduces bias and invalidates your results. Set guardrail metrics alongside your primary metric to catch unintended side effects. For example, if your primary metric is checkout completions, a guardrail metric might be average order value to confirm you are not trading revenue for volume.
Calculate sample size and run duration
Sample size calculation is not optional. It determines how long your test must run before results are trustworthy. Use your baseline conversion rate, the minimum detectable effect you care about, and the 80% power standard to calculate the number. Most A/B testing strategies recommend running tests for at least two full business cycles, which typically means 14 days minimum. That duration accounts for the novelty effect, where users respond differently to new experiences simply because they are new, not because the change is better.
Avoid the peeking problem
Stopping a test early because results look promising is one of the most common and damaging mistakes in testing analysis. Peeking at interim results and stopping upon seeing significance inflates the false positive rate from 5% to over 26%. That means more than one in four "winning" tests you call early is actually noise. The test must run its full planned course.
- Write your hypothesis and define your primary metric before launch.
- Calculate minimum sample size using your baseline rate and target effect size.
- Set a fixed end date based on traffic projections and the 14-day minimum.
- Lock your metrics and do not check results until the end date arrives.
- Document every detail: hypothesis, method, audience segment, and duration.
Pro Tip: Keep a shared test log with hypothesis, setup details, results, and lessons learned. Proper documentation builds institutional memory and prevents your team from repeating the same failed experiments six months later.
What common pitfalls undermine effective testing analysis?
Most testing programs fail not because of bad ideas but because of execution errors that corrupt the data. Knowing these pitfalls in advance is the fastest way to protect the integrity of your results.
- The multiple comparisons problem. Testing too many metrics at once inflates the chance of finding a false positive. Every additional metric you track increases the probability that one of them will appear significant by chance. Stick to one primary metric per test.
- Ignoring segment-level results. A test showing a 5% lift overall can mask divergent impacts across segments. Mobile users might respond negatively while desktop users drive the positive average. Always break results down by device type, traffic source, and key demographic groups before declaring a winner.
- The novelty effect. Users often engage more with anything new simply because it is unfamiliar. Running tests for at least two full business cycles lets initial novelty reactions stabilize so you measure genuine behavioral change.
- Changing the test mid-run. Adjusting a page element, swapping audience targeting, or shifting budget allocation after a test starts contaminates the data. Any change mid-run requires restarting the test from scratch.
- Stopping tests prematurely. Organizational pressure to show results fast is real. Calling a test early because leadership wants an answer produces misleading conclusions that cost more to fix than they saved in time.
Pro Tip: Schedule your tests to run through at least one full weekly business cycle, including weekends if your audience is active then. Consumer behavior on Saturday looks nothing like Tuesday, and a test that misses weekend data is missing a real segment of your audience.
How to analyze and interpret test results for maximum impact
Statistical significance tells you that the difference between your control and variant is unlikely to be random. It does not tell you the difference is large enough to matter. That distinction belongs to effect size.
Effect size measures the practical magnitude of a change. A result can be statistically significant with an effect size so small that implementing the change produces no meaningful revenue impact. Always evaluate both. A 0.2% lift in conversion rate on a page that receives 500 visitors per month is statistically interesting but commercially irrelevant. A 0.2% lift on a page driving 500,000 visitors per month is worth acting on immediately.
- Read segment results before overall results. Overall numbers are a starting point, not a conclusion. Segment by device, channel, new versus returning visitors, and geography to find where the effect is strongest.
- Treat inconclusive results as data. Non-significant results update your behavioral model and sharpen the next hypothesis. A test that shows no difference tells you the change you made does not move the needle for that audience, which is valuable information.
- Check for interaction effects. A variant that wins on desktop and loses on mobile creates a net-zero result overall. Segment analysis reveals this. Deploying the "winning" variant to all traffic in that scenario would hurt mobile performance.
- Plan your next test before you close the current one. The best testing programs treat each result as the input to the next experiment. Write your follow-up hypothesis while the current test data is still fresh.
For marketers building conversion rate optimization programs, the interpretation phase is where most of the learning happens. The test execution is mechanical. The analysis is where judgment and expertise create competitive advantage.
Key Takeaways
Effective testing analysis requires statistical rigor, disciplined execution, and systematic documentation to produce marketing decisions that hold up under scrutiny.
| Point | Details |
|---|---|
| Set standards before launch | Define your primary metric, significance level, and run duration before the test starts. |
| Run tests for at least 14 days | Two full business cycles account for the novelty effect and stabilize behavioral data. |
| Never stop a test early | Peeking inflates false positive rates from 5% to over 26%, making winners look real when they are not. |
| Segment results before concluding | Overall lift can mask negative impacts on mobile, new visitors, or specific traffic sources. |
| Document every experiment | Test logs build institutional memory and prevent teams from repeating failed experiments. |
Why most testing programs plateau before they should
The testing programs I have seen stall share one trait: they treat each test as a standalone event rather than part of a continuous learning system. Teams celebrate wins, quietly bury losses, and start the next test with no connection to what they just learned. That pattern produces a lot of activity with very little compounding improvement.
The hardest part of building a rigorous testing culture is not the statistics. It is resisting the organizational pressure to call tests early. Leadership wants results. Stakeholders want to see the new variant go live. The temptation to peek at day five and declare a winner is constant. The teams that resist that pressure and run tests to completion consistently outperform the ones that do not, because their data is actually reliable.
A/B testing success depends heavily on organizational culture, including velocity targets, infrastructure, and stakeholder education. That is not a soft observation. It is the reason two teams with identical tools and traffic volumes can produce wildly different quality of learning. The team that has educated its stakeholders on why tests must run full course will always generate more trustworthy data.
Cross-team communication matters more than most analysts admit. When a test result stays inside the analytics team, the rest of the organization keeps making the same assumptions the test just disproved. Sharing results, including inconclusive ones, across product, content, and paid media teams multiplies the value of every experiment you run. Build that habit early, and the whole organization gets smarter with each test cycle.
— Juan
How Gostellar helps marketers run better tests
Marketers who want to put these frameworks into practice need a tool that does not create friction between the idea and the experiment.

Gostellar is built for exactly that. Its no-code visual editor lets you set up A/B tests without engineering support, so the time between hypothesis and live test shrinks from days to minutes. Real-time analytics surface results as they accumulate, and advanced goal tracking connects test outcomes directly to the business metrics that matter. Gostellar's 5.4KB script keeps page performance intact while the test runs, which means you are not trading conversion data for site speed. Teams with under 25,000 monthly tracked users can start testing free and scale up as their programs grow.
FAQ
What is testing analysis in marketing?
Testing analysis is the structured process of designing, running, and interpreting marketing experiments to identify which changes improve campaign performance. It combines statistical methods with business judgment to produce reliable, repeatable decisions.
What significance level should I use for A/B tests?
The 2026 industry standard sets the significance level at 5% (alpha) with 80% statistical power and a minimum of 1,000 visitors per variation. These thresholds produce results reliable enough to act on.
How long should a marketing test run?
Tests should run for at least two full business cycles, typically 14 days minimum. Shorter tests risk overstating lift due to the novelty effect, where users respond to newness rather than genuine improvement.
What does an inconclusive test result mean?
An inconclusive result means the data did not detect a statistically significant difference between your control and variant. It is still useful because it rules out the tested change and helps refine the next hypothesis.
Why does segmented analysis matter in test results?
Overall test results can mask opposite effects across audience segments. A test showing a 5% overall lift might show a loss on mobile and a strong gain on desktop, making segment analysis critical before deploying any change.
Recommended
Published: 7/17/2026