
Prove SEO Test Wins in 2–4 Weeks: Testing SEO Optimization for SMBs
Testing SEO optimization, in practice, means running controlled A/B experiments that validate landing-page changes against one primary metric before you ship them site-wide. Start with a written hypothesis, calculate the sample size you need, and let the test run to completion instead of calling it early. This approach fits small marketing and growth teams that want conversion lifts they can actually defend in a meeting, not vanity wins based on a gut feeling.
TL;DR:
- Most SMB teams need thousands of visitors per variant to reliably detect a modest conversion lift, especially when baseline rates are below 5%.
- Proper hypothesis formulation and calculating sample size with four key inputs are crucial to avoid false positives and invalid results.
- Prioritizing tests on high-impact areas like headlines, pricing structure, and mobile flow using the ICE framework maximizes the chances of meaningful improvements.
- Running tests for at least two full business cycles and analyzing segmented results prevent false positives and reveal hidden performance differences.
- Qualitative research and larger effect tests are often more effective than underpowered experiments when traffic is too low for statistically valid A/B tests.
Table of Contents
- How Do You Set Up a Statistically Valid SEO Test?
- Which Tests Should You Run First?
- When Should You Call a Winner?
- What If Your Traffic Is Too Low for A/B Testing?
- What Counts as a Common SEO-Driven A/B Test?
- Where Do SEO Tests Go Wrong?
- What Do Real SEO Optimization Test Wins Look Like?
- Why Testing Discipline Beats Testing Volume
- Try a Lighter Way to Run Your Next Test
- Where to Go for Sample-Size Math and Deeper Reading
- Sources
- FAQ
How Do You Set Up a Statistically Valid SEO Test?
A test is only as good as the hypothesis behind it, and most SMB teams skip this step entirely. They pick a page, change something they like better, and hope. That is not experimentation; it is decoration.
Write the hypothesis in one sentence using this structure: "If [change], then [primary metric] will move by [amount], because [reason]." For example: "If we replace the generic headline with a benefit-driven one on our pricing page, then trial signup rate will increase by 10%, because visitors currently bounce without understanding the value in the first five seconds."
That sentence forces you to commit to three things before you build anything:
- The change you're testing, stated specifically enough that a developer or your visual editor tool could execute it without guessing.
- The primary metric, which should be one number, not three. Pick trial signups, add-to-cart rate, or demo requests, and let everything else be secondary.
- The reasoning, which keeps you honest about whether this test is worth running at all.
Secondary metrics matter too, just not as tiebreakers. If you're testing a pricing page headline, watch time-on-page, scroll depth, and support-chat volume as secondary signals that reveal side effects the primary metric might miss.
Sample size is where most teams either freeze up or ignore the math entirely. You need four inputs: your baseline conversion rate, the minimum detectable effect (MDE) you care about, a 95% significance level, and 80% statistical power.
Statistic Callout: A well-designed test requires a clear hypothesis, measurable metrics, and statistical validity from the start. Skipping sample-size math and stopping early are the two most common reasons tests fail, according to A/B testing best-practice guidance.
For SMBs without a data scientist on staff, a free online sample-size calculator gets you close enough. As a rough rule of thumb, if your baseline conversion rate is under 5%, you'll need thousands of visitors per variant to detect a modest lift. Higher baseline rates need less traffic to reach the same confidence.
Which Tests Should You Run First?
Traffic is finite, and so is your team's patience for tests that go nowhere. The ICE framework (Impact, Confidence, Ease) gives you a fast way to rank test ideas before you burn a single visitor on the wrong one.
Score each idea from 1 to 10 on all three dimensions, then multiply: Impact × Confidence × Ease. A headline rewrite on your highest-traffic landing page might score 8 (impact) × 7 (confidence) × 9 (ease) for a total of 504. Changing your button color from blue to green might score 3 × 4 × 10 for 120. The math makes the decision for you before your team spends a week debating font choices.
Prioritizing high-impact targets instead of chasing micro-optimizations is the single biggest lever SMB teams have, since limited traffic means limited chances to detect anything smaller than a substantive change.
Test these areas first, in roughly this order:
- Hero value proposition and headline
- Pricing page structure and plan framing
- Form length and field order
- Mobile checkout or signup flow
- Trust signals near the conversion point
Pro Tip: Keep a rolling backlog of test ideas with their ICE scores in a shared doc, and review it monthly. Teams that document a testing calendar and maintain a results library compound their learning instead of re-running the same failed idea six months later.
Aim for a velocity of one to four validated tests per month, depending on your traffic. Slower is fine. Sloppy is not.
When Should You Call a Winner?
The single fastest way to poison a test is to peek at results early and call a winner because the numbers look good on day three. Peeking is the largest source of false positives in A/B testing, full stop. Calculate your sample size before you launch, then let the test run until it hits that number.

Runtime matters as much as sample size. Run every test for at least two full business cycles, generally two to four weeks, so you capture different traffic sources, days of the week, and buying patterns. A test that only runs Monday through Wednesday will mislead you about weekend behavior.
Follow these steps once the test reaches its planned sample size:
- Check statistical significance. You want 95% confidence that the difference you're seeing isn't noise, paired with 80% power so you're not missing a real effect either.
- Read the confidence interval, not just the point estimate. A reported "12% lift" that carries a confidence interval of 2% to 22% tells a very different story than one running 10% to 14%.
- Weigh practical significance against implementation cost. A statistically significant 1% lift might not justify an engineering rebuild if the change is expensive to maintain.
- Check downstream and secondary metrics before declaring victory, since a variant that lifts signups but tanks retention isn't actually a win.
Statistic Callout: Multiple testing guides recommend a minimum runtime of two to four weeks alongside the 95% confidence and 80% power thresholds, and warn that early stopping is one of the most common causes of false positives.
Segment your results by new versus returning visitors, and mobile versus desktop, before you close the test out. A variant that wins overall but loses on mobile tells you something a blended number hides completely. Once you've analyzed the split, log the full result, including the losing variant's data, in a shared results library. Micro-conversions and segmented analysis reveal patterns that a single conversion number will never show you, and that documented history is what turns one test into an actual testing program.
What If Your Traffic Is Too Low for A/B Testing?
If you're not generating enough monthly visitors to reach statistical power in a reasonable window, don't force a test that will sit inconclusive for three months. Switch tactics instead.
- Run heatmaps and session recordings to see where visitors actually stop scrolling or hesitate before a form field.
- Use 5-second tests to check whether new visitors understand your value proposition at a glance.
- Interview five to eight recent customers about what almost stopped them from converting.
- Test on your highest-traffic page instead of a low-traffic one, even if it's not the page you originally wanted to change.
- Accept a larger minimum detectable effect. Testing for a 30% lift needs far less traffic than testing for a 5% lift.
Qualitative research and big-bet experiments often deliver more usable insight per hour of work than an underpowered A/B test that never reaches significance. If your traffic and margins suggest testing won't pay back within a reasonable window, redirect that budget into acquisition instead. Calculate expected value per visitor first. Sometimes more traffic beats more optimization.
What Counts as a Common SEO-Driven A/B Test?
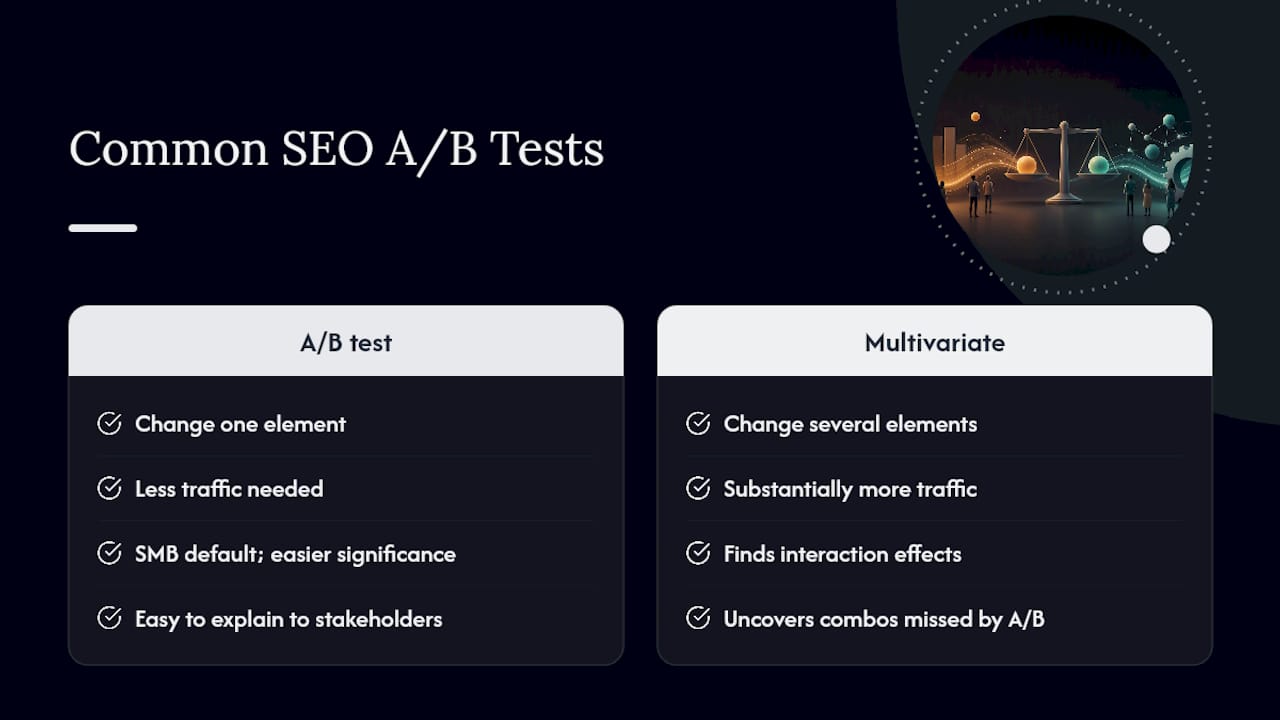
Most tests aimed at improving conversions from search traffic fall into two categories: simple A/B splits and multivariate tests. A/B tests change one element, like a headline, and measure the difference between the original and the variant. This is the right default for SMB teams because it needs less traffic to reach significance and the results are easy to explain to a stakeholder who doesn't care about statistics.
Multivariate tests change several elements at once (headline, image, and CTA together, for example) and measure how combinations perform against each other. They uncover interaction effects a simple A/B test would miss entirely, but they need substantially more traffic to reach the same confidence level, since you're effectively running several tests inside one.
Beyond structure, the most common experiments SMB teams run against search-driven landing pages include headline and messaging swaps, CTA wording and placement changes, form-length reduction, pricing-page layout changes, and mobile-specific flow adjustments. Testing one element at a time and segmenting the results keeps the analysis clean, which matters more for a small team than running an ambitious multivariate test you don't have the traffic to finish properly.
Where Do SEO Tests Go Wrong?
The biggest bias in SEO-driven experimentation is confirmation bias dressed up as data. A marketer runs a test, sees an early trend that matches what they wanted, and stops the test the moment it confirms their hunch. That's peeking, and it's the fastest route to a false positive.
Seasonality is another quiet killer. Running a two-week test that happens to span a holiday, a payday cycle, or a major news event will skew results in ways that have nothing to do with your landing page. Running across at least two full business cycles helps average that noise out.
Sample ratio mismatch, where your traffic split isn't actually 50/50 despite your setup saying it is, can silently invalidate a test. It usually points to a bug in your redirect logic or bot traffic hitting one variant more than the other. Check your actual split against your intended split before trusting any result.
Finally, testing too many things at once without the traffic to support it produces results that look clean but aren't. Most tests return no statistically significant difference when teams skip proper sample-size math, which is a normal outcome, not a failure. Treat an inconclusive test as information, not wasted effort.
What Do Real SEO Optimization Test Wins Look Like?
The pattern across documented A/B testing case studies is consistent: substantive changes beat cosmetic ones. Headline rewrites that clarify the value proposition, CTA wording changes that replace vague phrases like "Learn More" with specific action language, and pricing-page restructures tend to produce effect sizes large enough to detect with realistic SMB traffic, while button-color swaps and font tweaks often need traffic volumes most small teams will never reach.
A form-length reduction is one of the more reliable wins in this category. Cutting a signup form from eight fields down to three, asking only for what's truly needed to start a trial, consistently shows up in guidance as a high-confidence, high-ease test, which is exactly the kind of ICE-scored idea that belongs at the top of a backlog.
Mobile-specific experiments deserve their own line item, since segmenting mobile versus desktop performance frequently reveals that a winning desktop variant is actually a loser on mobile, or vice versa. Teams that only look at blended results miss this completely, and it's one of the most common reasons a "winning" test fails to move overall revenue once it ships.
Why Testing Discipline Beats Testing Volume
Running a lot of tests is easy. Running a testing program that actually teaches your team something month over month is harder, and that gap is where most SMB testing efforts quietly fail.
The teams that get real compounding value from experimentation are the ones documenting every test, win or lose, in a shared library instead of letting results live in someone's inbox. A lightweight 5.4KB script, a no-code visual editor, dynamic keyword insertion for personalized landing pages, and a free tier for businesses under 25,000 monthly tracked users all lower the friction to actually running that next test instead of putting it off for a sprint.
[Deeper case studies and author credentials to be added]
— Juan
Try a Lighter Way to Run Your Next Test
Most A/B testing platforms slow down the exact pages you're trying to optimize, which quietly undercuts the results you're chasing. Some A/B testing platforms use lightweight scripts designed to minimize load-time impact, so tests do not skew data by slowing down one variant.

Setup doesn't require a developer either. The no-code visual editor lets you build and launch a variant directly on the page, dynamic keyword insertion personalizes landing-page copy without a template rebuild, and goal tracking with real-time analytics shows you where a test stands without exporting anything to a spreadsheet. Many platforms offer a free tier for businesses under a certain monthly tracked user threshold, with paid tiers available as traffic grows.
If you're a marketer or product manager ready to turn this article's hypothesis template into a live test this week, start with Gostellar and launch your first experiment on the free tier before committing to anything.
Where to Go for Sample-Size Math and Deeper Reading
- Use a sample-size calculator before launching any test. Guessing at traffic needs is the fastest way to run a test that never reaches significance.
- Check how to track SEO performance for ongoing measurement once your test ships.
- Browse landing-page test ideas to seed your ICE backlog.
Sources
FAQ
Is A/B Testing Worth It for a Small Business?
Yes, if you have enough traffic to reach your calculated sample size within a few weeks. If your site gets only a few hundred visitors a month, qualitative research like heatmaps and user interviews will teach you more per hour than an underpowered test.
How Long Should an SEO Optimization Test Run?
Run every test for at least two full business cycles, generally two to four weeks, and always to your pre-calculated sample size rather than a fixed calendar date. Stopping early because results look promising is one of the most common causes of false positives in A/B testing.
What If My Site Doesn't Get Enough Traffic to Test?
Switch to qualitative methods like session recordings, 5-second tests, and direct customer interviews, or test on your highest-traffic page instead of the one you originally wanted to change. Accepting a larger minimum detectable effect also reduces the traffic you need to reach a valid result.
How Do I Pick the Right Primary Metric?
Choose one metric tied directly to business value, such as trial signups, demo requests, or completed purchases, and resist the urge to track three "primary" metrics at once. Everything else you're curious about becomes a secondary metric that you watch, not the number that decides the test.
Does Gostellar Work for Teams With Limited Engineering Resources?
Yes. Gostellar's no-code visual editor and 5.4KB script are built specifically for marketing and growth teams to launch tests without pulling a developer into the process, and the Sandbox plan is free for businesses tracking under 25,000 monthly users at Gostellar.
Recommended
Published: 9/18/2026