
Web A/B Testing: A Practical Guide for Marketers
TL;DR:
- Web A/B testing replaces guesswork with structured experiments that rely on real visitor data and statistical confidence. Proper preparation, including defining primary goals and testing one variable at a time, ensures reliable results and effective website improvements. Avoiding common pitfalls like premature stopping and underpowered tests enhances the accuracy and usefulness of your testing program.
Most website changes are educated guesses. You move a button, rewrite a headline, or shorten a form, then watch your analytics hoping something shifts. Web A/B testing replaces that guesswork with a structured experiment where real visitors tell you, with statistical confidence, which version actually works better. This guide walks you through every stage of the process, from defining your hypothesis to acting on your results, with enough rigor to produce findings you can trust and enough clarity to get started without a statistics degree.
Key takeaways
| Point | Details |
|---|---|
| Plan before you test | Define your primary metric, sample size, and winner criteria before you launch a single experiment. |
| One variable at a time | Changing multiple elements simultaneously makes it impossible to know what drove any difference in results. |
| Respect minimum runtime | Run tests for at least 24 to 72 hours to avoid false readings caused by day-of-week traffic patterns. |
| Statistical power matters | Set power at 80% or higher so your test can actually detect a real lift when one exists. |
| Act on results with context | Combine p-values and confidence intervals with secondary metrics to avoid optimizing one number at the expense of everything else. |
What web A/B testing actually means
A/B testing, known formally as split testing or controlled experimentation, is the practice of showing two versions of a webpage to separate groups of visitors simultaneously, then measuring which version drives more of the behavior you care about. Version A is your control, the current experience. Version B is your challenger, with one deliberate change. A standard 50/50 split means half of your visitors see each version, and the winner replaces the loser once results reach significance.

The ab testing definition sounds simple, but the practice involves statistical discipline that many marketers skip. That shortcut is exactly why most tests produce unreliable results. Done right, a website A/B test turns your traffic into a research panel that continuously improves your conversion rate without any guesswork.
How to prepare before you run any test
Preparation separates experiments that teach you something from experiments that waste weeks and produce noise. Here is what you need to lock in before touching your site.
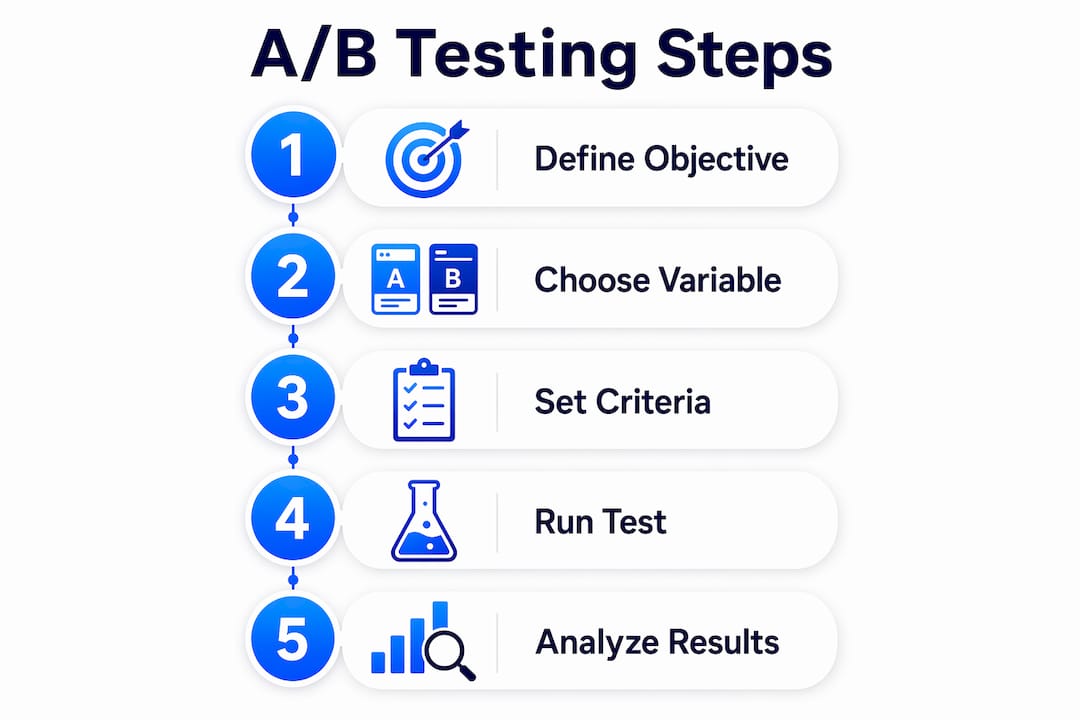
Define your primary objective first. This is the single metric that determines a winner. Common choices include click-through rate on a CTA, form completions, or purchases. Tracking primary and secondary objectives prevents the trap of declaring a winner based on one metric while another critical behavior quietly gets worse. Set your secondary metrics before launch so you can monitor them without being tempted to use them to override your primary result.
Choose one variable per test. This is non-negotiable. Pre-defining win criteria and limiting tests to one variable is what makes your findings usable. If you change the headline, the button color, and the hero image at the same time and conversions go up, you have no idea which change caused it. That is not a test. That is a coin flip with extra steps.
Calculate your required sample size. This is where most marketers skip a critical step. Standard sample size planning uses four inputs: your current baseline conversion rate, the minimum detectable effect you care about, a confidence level of 95% (z-score 1.96), and statistical power of 80%. The math matters because detecting a 2% lift over a 3% baseline requires over 100,000 visitors per variant. If your site cannot deliver that, you need to either test a larger change or accept that a formal experiment is not feasible right now.
Here are the most common elements worth testing on a website:
- CTAs: button copy, color, size, and placement
- Headlines: value proposition framing, length, and specificity
- Form length: number of fields, labels, and placeholder text
- Media: hero images, videos, or no media at all
- Page layout: content order, whitespace, and visual hierarchy
Pro Tip: If your site gets fewer than 5,000 visitors per week, small lifts are undetectable without impractically large sample sizes. Focus on testing bigger, bolder changes where even a modest traffic volume can surface a meaningful signal.
Running your A/B test step by step
Once your hypothesis is defined and your sample size is calculated, you are ready to execute. Here is the process in order.
-
Build your control and variation. Create version B through your CMS, a no-code visual editor, or directly in code. The change should be surgical. One element, one difference.
-
Set up random assignment. Visitors must be randomly assigned to a variant and then shown the same version on every subsequent visit during the test. Inconsistent exposure corrupts your data. A session cookie or user ID hash is the standard mechanism for maintaining consistent user experience across sessions.
-
Configure your analytics events. Misconfigured event taxonomy is one of the most common reasons tests produce unreliable conclusions. Before launch, verify that your conversion events fire correctly for both variants and that variant exposure is being logged separately. A/B testing tools with built-in reporting handle this automatically. If you are going the DIY route, a minimal working A/B test requires about 20 lines of JavaScript plus custom analytics events to track which variant each visitor saw.
-
Launch and set a minimum runtime. Do not stop a test the moment you see a promising result. A minimum runtime of 24 to 72 hours is the baseline, but most tests need at least one full business cycle to account for weekday versus weekend behavior differences. Two weeks is a reliable standard for most B2B sites.
-
Resist the urge to peek. Checking results daily and stopping when you see significance is a known cause of false positives. The statistical framework assumes you look at the data once, at the predetermined endpoint.
-
Manage segmented or multi-language audiences separately. If your site serves audiences in different languages or regions, run separate tests for each segment. Pooling mixed audiences into one test obscures real behavioral differences and produces averages that represent nobody.
Pro Tip: For teams using Firebase web A/B testing, the integration with Google Analytics and Remote Config gives you a structured framework for tracking both primary and secondary goals without custom event wiring. It is a strong option if you are already inside the Google ecosystem.
Mistakes that kill test validity
Even well-planned tests fail when execution breaks the rules. These are the pitfalls that produce misleading results and wasted cycles.
-
Peeking early and stopping. This inflates false positive rates dramatically. When you check significance repeatedly during a test, you will almost always find a moment where the data looks significant by chance. Commit to your end date before you start.
-
Underpowered tests. Statistical power is the probability that your test detects a real lift when one actually exists. Running a test without enough traffic to achieve 80% power means you will routinely miss true effects. You end up concluding nothing changed when something did.
-
Testing multiple variables at once. Running a multivariate test without the proper framework turns your results into guesswork. Mixed variable tests yield ambiguous conclusions that cannot be acted on with confidence.
-
Ignoring the "no peeking" rule. Most statistically significant A/B results fail because marketers violate sample size and timing rules. This is the single most common error in practice.
-
Skipping qualitative context. A test showing a 15% lift in clicks means little if session recordings reveal that visitors who clicked immediately bounced off a confusing next step. Numbers alone do not tell the full story.
When your traffic is too low for a reliable experiment, qualitative research is not a fallback. It is the right tool. Use session recordings, heatmaps, and customer interviews to form sharper hypotheses before you invest in a formal test.
Analyzing your results and acting on them
When your test reaches its predetermined endpoint, here is how to read the results correctly.
Start with your p-value and confidence interval together. A p-value below 0.05 tells you the observed difference is unlikely to be random chance at the 95% confidence level. But the confidence interval tells you the range of likely true effects. A result like "+12% conversions (95% CI: +2% to +22%)" is actionable. A result like "+8% (95% CI: -3% to +19%)" is not, because the true effect could be negative.
| Scenario | What it means | What to do |
|---|---|---|
| Significant lift, tight CI | Strong evidence of a real improvement | Roll out the winner, document the insight |
| Significant lift, wide CI | Possible improvement but high uncertainty | Consider rerunning with a larger sample |
| No significance, adequate sample | True difference is likely small or absent | Abandon this hypothesis, form a new one |
| Borderline significance | Noise or insufficient traffic | Do not declare a winner; extend or rerun |
Interpreting significance correctly means accounting for both sample size and effect size, not just whether your testing tool shows a green checkmark. Tools with built-in reporting are convenient, but they can create a false sense of certainty if you do not understand what the numbers actually mean.
Always review your secondary metrics before rolling out a winner. A lift in CTA clicks that coincides with a drop in checkout completions is not a win. It is a warning.
Pro Tip: After rolling out a winner, run a follow-up test on the next biggest variable on the same page. Conversion improvements compound when you iterate systematically rather than declaring victory and moving on.
My honest take on testing discipline
I have reviewed hundreds of A/B tests across marketing teams of all sizes, and the pattern is almost always the same. Teams with the right hypothesis and the wrong process produce results that feel decisive in the moment and fall apart within a quarter. The discipline is not in the tools. It is in the pre-commitments.
What I have learned is that treating a/b testing for websites as a scientific experiment means fixing your sample size, your end date, and your success criteria before you press launch. Not after you have been checking the dashboard every morning for three days. The moment you let a promising early trend influence your decision to stop, you have introduced bias that no tool can correct for.
The other thing I would push back on: statistical significance is necessary but not enough. I have seen plenty of tests that hit 95% confidence and produced changes that made no sense once you talked to actual users. Combine your quantitative results with qualitative context, whether that is a handful of user interviews or a quick session recording review, and your win rate on implemented changes goes up substantially.
The marketers who build the best testing programs are not the ones with the most sophisticated tools. They are the ones who calculate power before they start, stick to their timeline, and treat each test as one data point in a longer learning program, not a final answer.
— Juan
Start testing smarter with Gostellar

If you are ready to move from theory to practice, Gostellar is built for exactly this. The platform runs on a 5.4KB script that adds virtually no load time to your pages, which means your experiment does not penalize the visitor experience it is trying to improve. The no-code visual editor lets you build variations without touching your codebase, and real-time analytics give you clean data on both variant exposure and conversion events from day one. Whether you are running your first website A/B test or iterating on a mature testing program, Gostellar handles the infrastructure so you can focus on the hypotheses. There is a free plan for sites under 25,000 monthly tracked users, so there is no reason to wait.
FAQ
What is A/B testing on a website?
A/B testing on a website is a controlled experiment where two versions of a page are shown to separate groups of visitors simultaneously to determine which drives better performance on a defined metric, such as clicks, signups, or purchases.
How long should a web A/B test run?
Tests should run for a minimum of 24 to 72 hours, but most require at least one full business cycle, typically two weeks, to account for day-of-week traffic variation and reach a reliable sample size.
How do you know if your A/B test result is valid?
A result is valid when it reaches your pre-set significance threshold (usually 95% confidence), was not stopped early, had an adequate sample size based on your power calculation, and shows no negative movement in secondary metrics.
Can you A/B test with low website traffic?
Sites with fewer than 5,000 visitors per week cannot reliably detect small conversion lifts. In those cases, test larger, more dramatic changes where the effect size is big enough to surface with the traffic you have, or use qualitative research to sharpen your hypothesis first.
What is the difference between A/B testing and multivariate testing?
A/B testing changes one variable and compares two versions, making it easy to identify the cause of any lift. Multivariate testing changes multiple elements simultaneously and requires significantly more traffic to produce statistically valid results for each combination.
Recommended
Published: 5/28/2026