
What is analytics? A practical guide for marketers
TL;DR:
- Analytics involves collecting, analyzing, and interpreting data to inform marketing decisions and growth.
- Different analytics types—descriptive, diagnostic, predictive, prescriptive—guide each stage of testing.
- Small teams can gain a competitive advantage by quickly leveraging analytics for rapid, informed experimentation.
Most marketers assume analytics means pulling a report and scanning a bar chart. That's a costly misconception. Analytics in digital marketing is actually the disciplined process of collecting, analyzing, and interpreting data from campaigns, websites, and user interactions to drive real decisions, especially for A/B testing. If you're running experiments or trying to grow a business with limited resources, understanding analytics at a deeper level is what separates guesswork from consistent, measurable progress. This guide will give you that clarity.
Table of Contents
- Defining analytics for marketers
- Types of analytics and their role in marketing decisions
- A/B testing through the analytics lens
- Common mistakes: Interpreting analytics and test results
- Compounding growth with analytics: Best practices
- Why mastering analytics gives small teams a competitive edge
- Take your analytics further with Stellar
- Frequently asked questions
Key Takeaways
| Point | Details |
|---|---|
| Analytics drives informed tests | Applying analytics lets marketers make smarter decisions with A/B tests and continuous optimization. |
| Know your frameworks | Understanding descriptive, diagnostic, predictive, and prescriptive analytics leads to better experiments. |
| Avoid common pitfalls | Mistaking statistical for practical significance or peeking at data undermines valid results. |
| Document, learn, improve | Recording all test outcomes fuels ongoing growth by turning analytics into compounding knowledge. |
Defining analytics for marketers
Analytics isn't a tool you log into. It's a mindset and a methodology. The dashboard is just the surface. The real work happens when you ask the right questions, choose the right data, and interpret what you find with enough rigor to act confidently.
For digital marketers at small and medium-sized businesses (SMBs), this distinction matters a lot. You don't have enterprise-level data teams or infinite ad budgets. Every decision you make needs to be grounded in something more reliable than instinct. That's where analytics becomes your most valuable asset.
"Analytics in digital marketing is the process of collecting, analyzing, and interpreting data from campaigns, websites, and user interactions to inform decisions, particularly for optimizing A/B tests and driving growth."
If you want to build a solid foundation, it helps to start with marketing analytics for beginners before moving into more advanced experimentation frameworks.
Here's what analytics actually does for a marketer:
- Reveals patterns you can't see manually. Conversion rates, bounce behaviors, funnel drop-offs. These are invisible without data.
- Validates or disproves your assumptions. You might think your homepage headline is working. Analytics will tell you for sure.
- Creates a feedback loop. Each campaign or test feeds data back into the next cycle, making every subsequent decision smarter.
- Reduces decision fatigue. When you have a clear framework for reading data, you stop debating opinions and start acting on evidence.
The shift from "we have a dashboard" to "we have an analytics practice" is significant. Dashboards are passive. An analytics practice is active. It involves defining goals, setting up tracking correctly, forming hypotheses, running experiments, and drawing conclusions that inform what happens next. Done consistently, this is what powers compounding growth over time.
Types of analytics and their role in marketing decisions
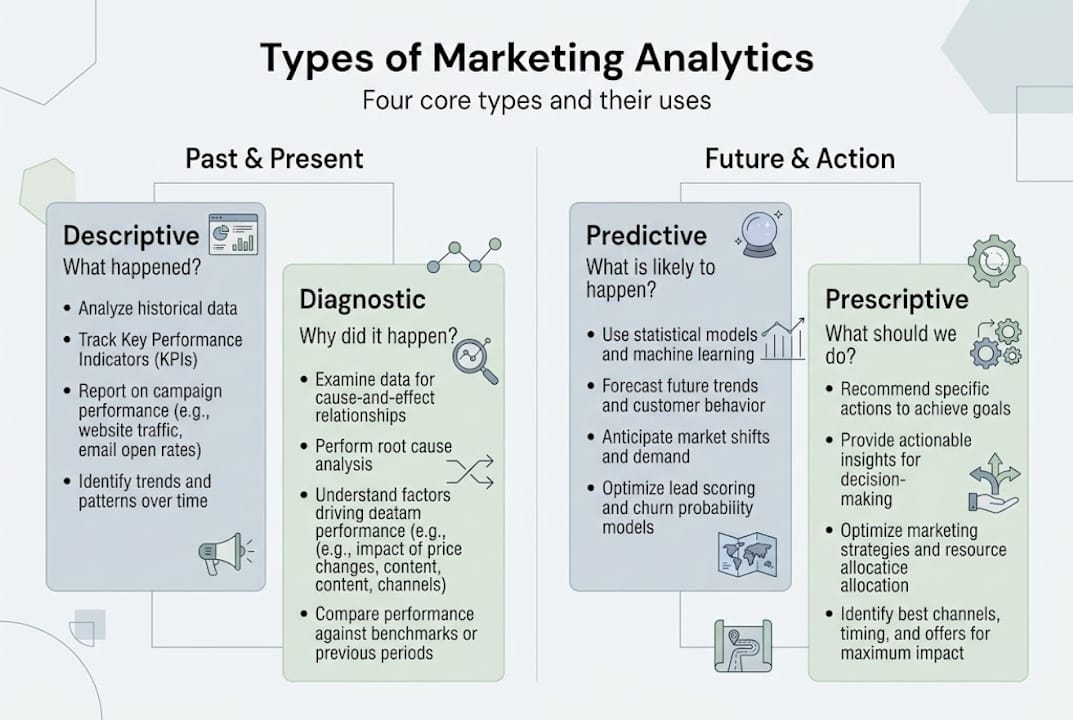
With the definition clear, the next step is understanding the four main types of analytics and how each one plays a specific role in your marketing experiments.
Key methodologies include descriptive analytics for summarizing past performance, diagnostic for root causes, predictive for forecasting, and prescriptive for recommendations. Think of these as four questions you can ask at different stages of your marketing work.

| Type | Question answered | Marketing example | A/B testing stage |
|---|---|---|---|
| Descriptive | What happened? | "Our CTR dropped 15% last month." | Post-test reporting |
| Diagnostic | Why did it happen? | "The drop followed a headline change." | Root cause analysis |
| Predictive | What will happen next? | "This segment is likely to churn." | Hypothesis formation |
| Prescriptive | What should we do? | "Test a shorter CTA to improve clicks." | Action and implementation |
Here's how to apply each type in a real testing workflow:
-
Start with descriptive analytics. Before you run any test, understand your baseline. What are your current conversion rates, average session durations, and click-through rates? This gives you a reference point for measuring change.
-
Use diagnostic analytics to identify problems. If your email open rate is below industry average, diagnostic analysis helps you pinpoint why. Is it the subject line? The send time? The list segment? You can't test effectively if you don't know what you're fixing.
-
Apply predictive analytics to prioritize tests. If behavioral data shows that users who view three or more product pages convert at a much higher rate, that's a signal to test onboarding flows that drive users toward that behavior.
-
Let prescriptive analytics guide your next move. After a test concludes, prescriptive thinking turns the result into a clear action. Did version B outperform version A? Roll it out, document the win, and let the insight inform your next hypothesis.
Understanding where each type fits into your workflow helps you use data purposefully rather than reactively. Check out A/B testing best practices for more on how these analytics types connect to structured experimentation.
A/B testing through the analytics lens
Knowing the types of analytics is useful. Seeing them applied to A/B testing is where it gets actionable. Every phase of a well-run test is guided by one of those four analytics modes.
A/B testing involves hypothesis formulation, randomization, statistical analysis with p-values below 0.05, and confidence intervals that tell you how reliable your result is. These aren't optional technical formalities. They're the difference between a test result you can trust and one that misleads you into a bad decision.
Here's the proper sequence for an analytics-driven A/B test:
-
Form a hypothesis. Use diagnostic analytics to identify a friction point. Write your hypothesis as: "Changing X will improve Y because Z." Be specific. "Changing the CTA button color to green will increase click-through rate because it creates stronger visual contrast" is a testable hypothesis. "Let's try a green button" is not.
-
Set up randomization. Split your audience randomly and equally between the control (version A) and the variant (version B). This eliminates selection bias, one of the most common sources of misleading test results.
-
Determine your sample size before you start. Use a statistical power calculator to estimate how many visitors you need to detect a meaningful difference. Running a test with too little traffic will give you unreliable results. Running it on too much traffic wastes time and resources.
-
Execute the test without interference. Let it run until you hit statistical significance. Don't peek at results mid-test and make decisions based on early trends.
-
Analyze the results. Did version B beat version A with a p-value below 0.05? That means there's less than a 5% chance the result is random. Combine this with a confidence interval to understand the range of the likely true effect.
-
Implement the winning variant and document everything. Even tests that "fail" teach you something. Document the hypothesis, the result, and the insight. That knowledge compounds over time.
Pro Tip: "Peeking" at test results before reaching statistical significance is one of the most common mistakes in A/B testing. It inflates false positive rates dramatically. Commit to your predetermined sample size, and only read results after you've hit it. For more detail on analyzing test results correctly, walk through the full methodology before your next experiment.
You can also explore a deeper breakdown of A/B testing best practices to sharpen your testing process at every stage.
Common mistakes: Interpreting analytics and test results
Analytics supports strong testing, but is often misunderstood. The most dangerous mistakes aren't the obvious ones. They're the subtle errors that look like rigor but lead you in the wrong direction.
One of the biggest traps is confusing statistical significance with practical significance. A result can be statistically vs practically significant at the same time while being completely useless for your business. For example, a 0.3% lift in conversion rate might reach p < 0.05 with a very large sample size, but implementing the winning variant might cost more in development time than the revenue it generates. Always ask: "Even if this is real, does it matter enough to act on?"
"Contrasting viewpoints: Frequentist vs Bayesian approaches are both prone to peeking if misused. A/B testing is preferred over multivariate testing for low-traffic SMBs. Statistical vs practical significance means small lifts may not justify implementation."
Here's a quick comparison to make this concrete:
| Scenario | Statistical significance | Practical significance | Decision |
|---|---|---|---|
| 0.3% lift, p = 0.02, large sample | Yes | No | Don't implement |
| 6% lift, p = 0.04, moderate sample | Yes | Yes | Implement |
| 4% lift, p = 0.12 | No | Possibly | Run longer or retest |
| 1% lift, p = 0.001, huge traffic | Yes | No | Skip, not worth the effort |
Other common mistakes to avoid when interpreting analytics results:
- Running tests too short. Weekly traffic fluctuations, day-of-week effects, and seasonal spikes can distort your results if a test runs for only a few days. Aim for at least two full business cycles.
- Testing too many variables at once on low-traffic sites. Multivariate testing requires exponentially more traffic than A/B testing. If you're an SMB with modest monthly visitors, stick to single-variable A/B tests.
- Misapplying Bayesian vs Frequentist methods. Frequentist testing gives you a p-value. Bayesian testing gives you a probability that one variant is better. Both are valid, but both can mislead you if you peek at interim results and make early calls. Know which method your testing tool uses and follow the rules that come with it.
- Ignoring segment-level data. A test might show neutral overall results while hiding a strong positive effect in one user segment. Always cut your data by device type, traffic source, and user behavior before drawing conclusions.
- Not documenting losing tests. A failed test is still knowledge. If you don't record why you thought the test would work and why it didn't, you're throwing away information that could prevent the same mistake later.
Compounding growth with analytics: Best practices
Addressing common mistakes sets the stage for applying analytics for ongoing marketing growth. The marketers who win over time aren't the ones who run the most tests. They're the ones who learn the most from each test and build on those learnings systematically.
Growth loops that follow an ideate-prioritize-test-analyze cycle build compounding knowledge. Each completed loop feeds better ideas into the next cycle, making your testing program smarter and more focused over time. This is the core principle behind sustainable, analytics-driven growth.
Here's how to build this loop into your practice:
- Ideate from data, not opinions. Use descriptive and diagnostic analytics to surface real friction points. Let the data generate your hypotheses, not gut feeling or what a competitor is doing.
- Prioritize ruthlessly. Not every test idea is worth running. Use a simple prioritization framework like ICE (Impact, Confidence, Ease) to rank your ideas and tackle the highest-value tests first.
- Test with statistical rigor. Run to significance, avoid peeking, and use appropriate sample sizes. For digital marketers at SMBs, optimizing limited traffic means every test must be designed carefully to extract maximum signal from minimum data.
- Analyze beyond the headline metric. Don't just check whether the primary goal was met. Look at secondary metrics, segment-level data, and any unintended effects on user behavior elsewhere in the funnel.
- Document everything, including failures. A shared test log is one of the most underrated growth assets a small team can build. It prevents repeated mistakes, speeds up onboarding for new team members, and becomes a library of institutional knowledge.
- Benchmark against channel-specific rates. A 2% email click-through rate might be excellent for one industry and terrible for another. Benchmark against relevant rates in your specific channel and niche so your evaluation of test results is grounded in realistic expectations.
Pro Tip: Decision fatigue is real in testing-heavy teams. When you have too many test ideas and no clear framework, you'll waste time in debates and slow your learning velocity. Commit to a prioritization system and let the data make the call.
Using an A/B testing checklist before every experiment helps standardize your process, reduce errors, and make sure no critical step gets skipped.
Why mastering analytics gives small teams a competitive edge
Here's the perspective most articles won't give you. Large companies have bigger budgets, more traffic, and dedicated data teams. And yet, some of the sharpest marketing insights come from lean SMB teams. Why? Because small teams can actually move faster.
A mid-market company might take three weeks to get a test approved, set up, and launched. A small, analytics-savvy marketing team can go from insight to live test in two days. That speed advantage compounds dramatically over a year. If you run twice as many well-designed tests as a competitor, you accumulate twice as much learning, and that learning accelerates every future decision.
The key is treating analytics not as a reporting function but as a learning engine. Every test, every data point, every failed hypothesis is an input into a smarter next move. Most big teams are too slow and too siloed to exploit that loop effectively.
The uncomfortable truth is that analytical rigor isn't just for data scientists. Any marketer who learns to form a real hypothesis, read a confidence interval, and document results is already operating at a level most teams never reach. That's a genuine edge. Read more about A/B testing for smarter decisions to see how this mindset plays out in practice.
Take your analytics further with Stellar
If this guide has clarified what analytics really means for your marketing work, the next step is putting it into practice without friction.

Explore Stellar, the A/B testing platform built specifically for marketers and growth teams at SMBs. Stellar's real-time analytics, no-code visual editor, and advanced goal tracking give you everything you need to run rigorous tests without needing a developer or a data scientist. The platform's 5.4KB script means your site performance stays intact while you experiment. Whether you're running your first test or your hundredth, Stellar is designed to make every experiment faster, cleaner, and more actionable. Start with the free plan and start compounding your marketing knowledge today.
Frequently asked questions
What are the four types of analytics used in marketing?
Descriptive, diagnostic, predictive, and prescriptive analytics help marketers analyze past results, identify root causes, forecast outcomes, and recommend specific actions across campaigns and experiments.
Why is statistical significance important in A/B testing?
Statistical significance, typically expressed as a p-value below 0.05, ensures that A/B test results are unlikely to be due to random chance, giving you the confidence to make business decisions based on what you observed.
What is the difference between statistical and practical significance?
Statistical significance means a result is unlikely to be random, while practical significance means the size of the effect is large enough to justify acting on it, which is a distinction that matters when deciding whether a winning variant is worth implementing.
How can SMBs use analytics for better marketing outcomes?
Analytics powers data-driven A/B testing for SMBs by helping teams form clear hypotheses, run experiments with appropriate statistical rigor, and continuously build on each result to improve conversion rates and campaign performance over time.
Recommended
Published: 4/26/2026